📊 ALL INDICATORS OF BINANCE
In simple terms: how to read, understand, and not drain your deposit
Indicators are not a button to “earn”,
these are tools for reading the market.
🧭 1. TREND — WHERE TO LOOK AT THE MARKET
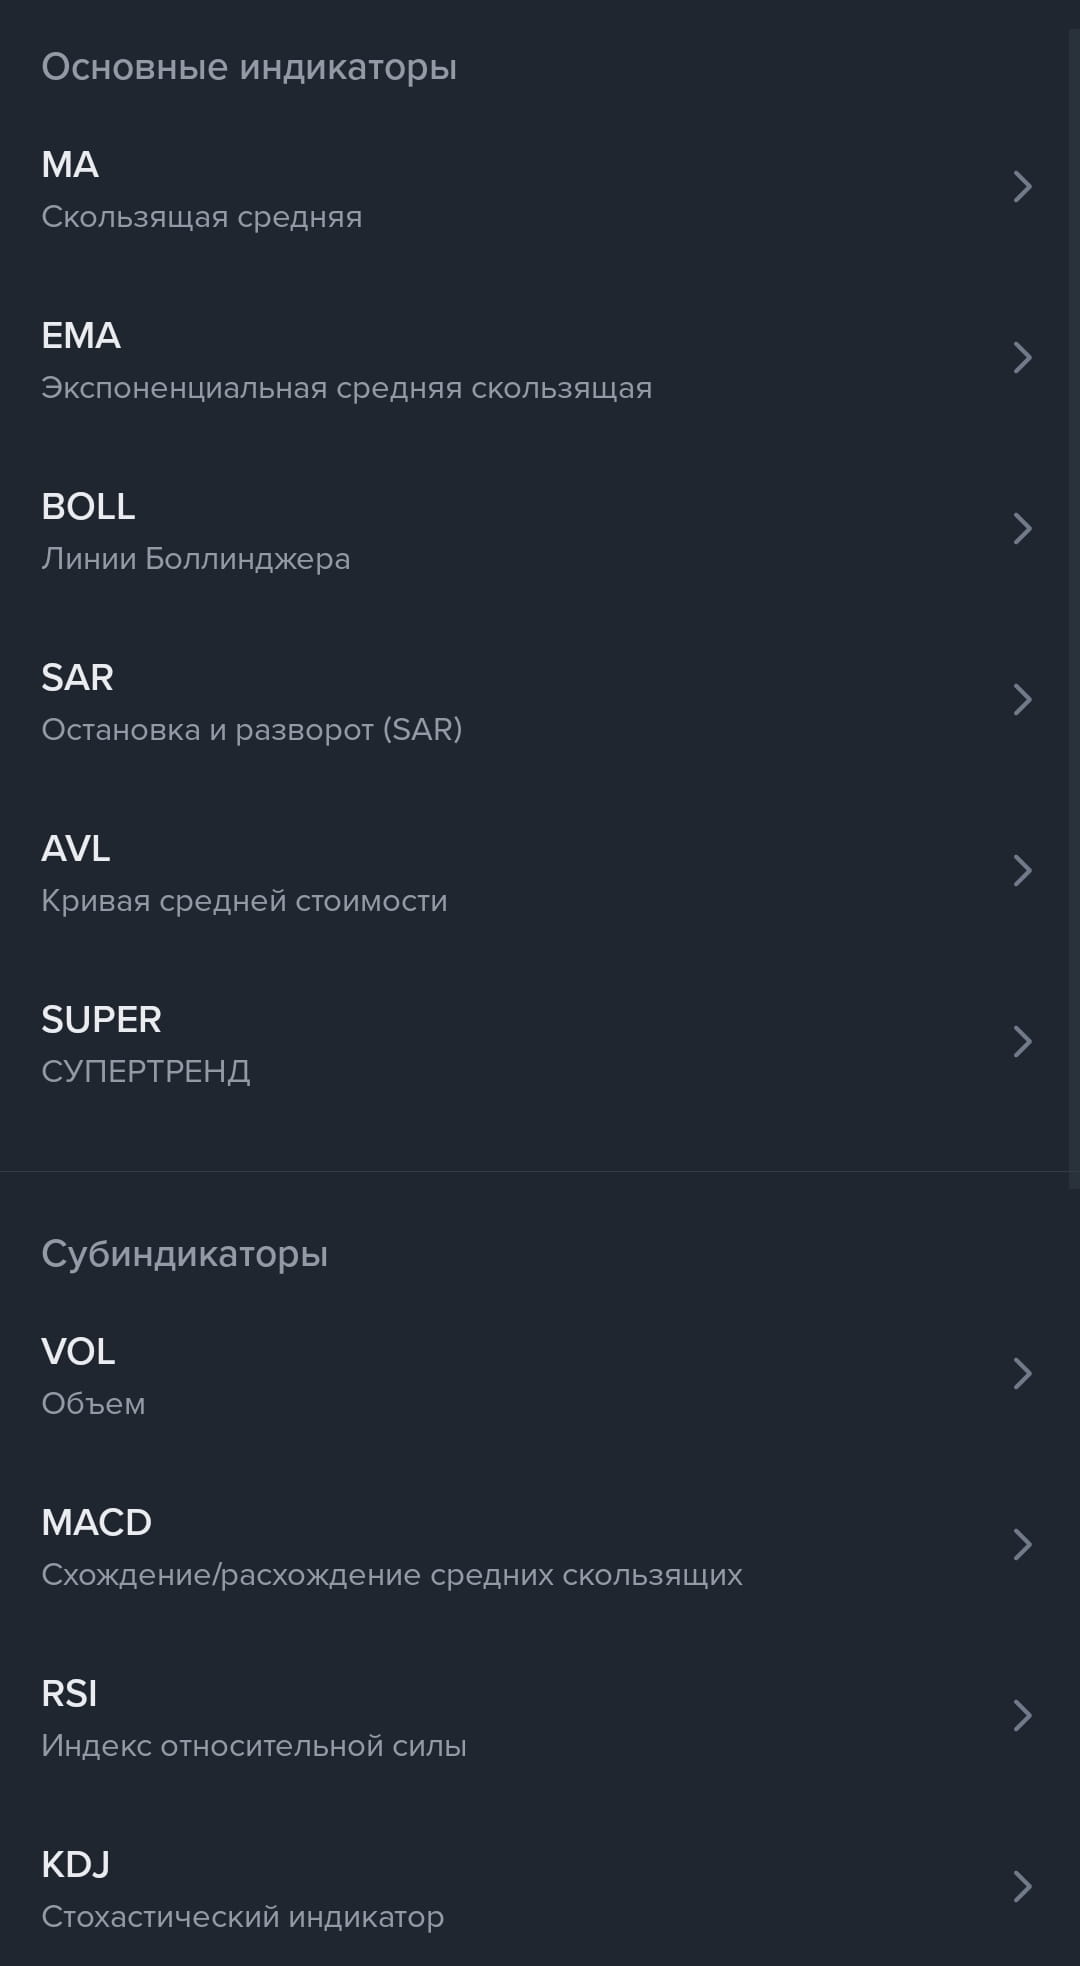
🔹 MA / EMA
Average price per hour.
Price above → bullish market
Price below → bearish
EMA reacts faster → useful for entries
📌 Classic: EMA 50 / 200
🔹 SuperTrend
One of the best trend indicators.
🟢 Green — long context
🔴 Red — short context
Color change ≠ entry, but a warning
🔹 Parabolic SAR
Points above/below the price.
Under the price → uptrend
Above the price → downtrend
Change of side → possible reversal
⚡ 2. STRENGTH OF MOVEMENT — IS THERE FUEL
🔹 Volume (VOL)
Price without volume — lies
Large volume + movement → real impulse
Low volume + movement → fake
🔹 AVL (Average Volume Line)
Average volume.
Volume above average → the market is “alive”
Below → flat / manipulation
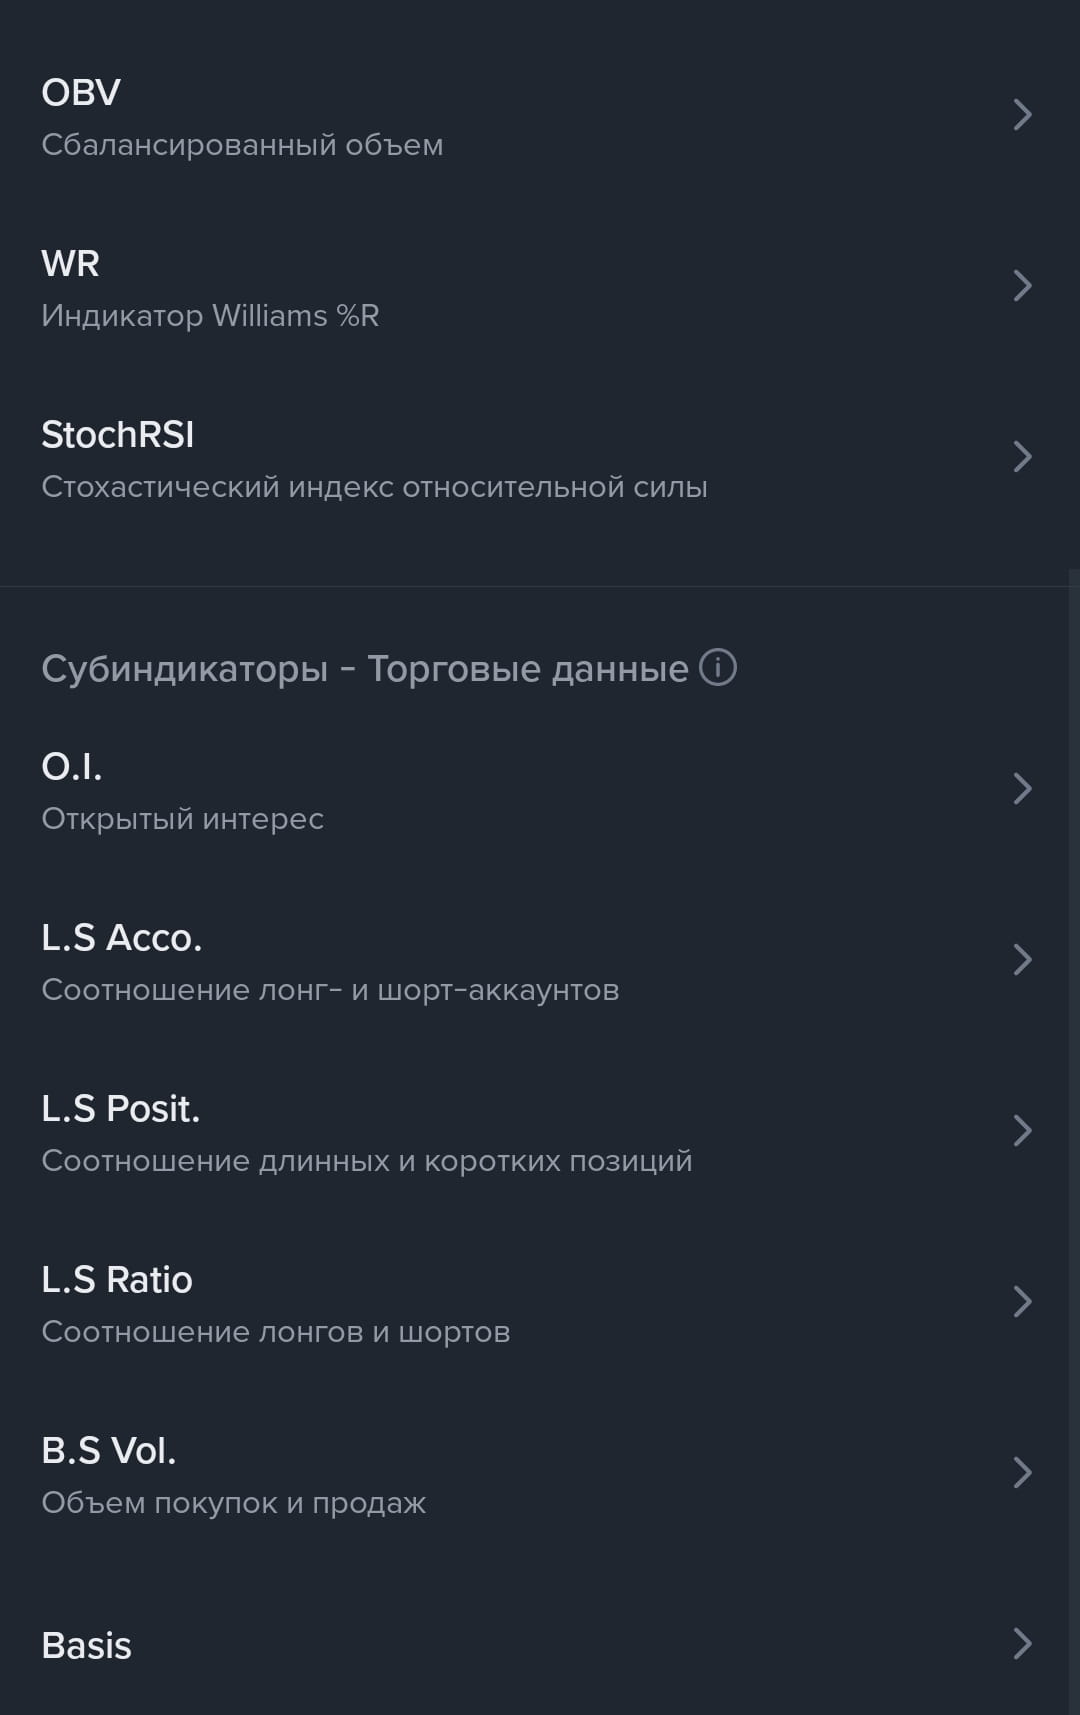
🔹 OBV
Shows whether money is entering BEFORE the price movement.
Price is stable, OBV is rising → accumulation
Price is rising, OBV is falling → distribution
🔹 MACD
Impulse + trend.
Crossings → change of rhythm
Histogram is rising → movement is gaining strength
🎯 3. ENTRIES — WHERE TO ACT BEST
🔹 RSI
Overbought / oversold.
70 — expensive
<30 — cheap
⚠️ In a trend, RSI can get “stuck”
🔹 KDJ
More aggressive RSI.
Gives early signals
Good for scalping
🔹 Stoch RSI
RSI inside RSI 😄
Very sensitive
Works better with the trend
🔹 Williams %R (WR)
Another oscillator.
-20 → overbought
-80 → oversold
🔹 Bollinger Bands
Volatility.
Upper limit → possible pause
Lower → possible bounce
Contraction → warning of strong movement
🧠 4. DERIVATIVE DATA — WHAT THE CROWD DOES
🔹 Open Interest (O.I.)
How many open positions.
Price ↑ + OI ↑ → new money
Price ↑ + OI ↓ → closing positions
🔹 Long / Short Accounts
Where most people are.
When everyone is in one direction — the market is preparing a surprise
🔹 Long / Short Positions
Where the money is, not accounts.
👉 More important than Accounts
🔹 Long / Short Ratio
Extreme values = risk of reversal
🔹 Buy / Sell Volume
Who is more aggressive.
Buy > Sell → buyers are pushing
Sell > Buy → sellers dominate
🧩 5. BASIC — THE FOUNDATION OF EVERYTHING
Candles, timeframe, scale.
There is no point in indicators if
you don’t understand the price structure.
🛠 REAL SETUP (MINIMUM)
🔰 Beginner:
EMA 50 / 200
Volume
RSI
🧠 Experienced:
EMA + SuperTrend
Volume + OBV
OI + L/S Ratio
❌ MAIN MISTAKES
❌ 10 indicators = 0 clarity
❌ Trading without volume
❌ Blind faith in signals
🔑 MAIN RULE
Price shows the DIRECTION
Volume shows the TRUTH
Data — show TRAPS
📌 Keep the post
📌 Re-read before deals
📌 And remember: indicators don’t trade — you trade
#Binance #Indicators #theory #TradingTopics