
HBAR is trading sideways between $0.162 and $0.178, indicating consolidation but hinting at an upcoming bullish reversal.
The Relative Strength Index is trending upward, showing an improvement in buying pressure; moving above 50.0 will confirm bullish strength and renew investor interest.
A breakout above $0.178 could push HBAR to $0.200, while a failure may bring it back to $0.162 or even $0.154.
The price of HBAR has traded sideways over the past few days, showing signs of consolidation after a period of weak investor participation.
Limited market support has kept the token stable, but momentum seems to be changing. Technical indicators suggest renewed optimism, implying that a potential recovery could happen soon for HBAR.
HBAR shows bullish signals
The relative strength index (RSI) shows an upward trajectory, indicating improved buying pressure on HBAR. This rise suggests increasing investor confidence after nearly three weeks of quiet activity.
However, the relative strength index remains below the neutral mark of 50.0, indicating that bullish momentum has not yet been fully confirmed.
Moving above the threshold of 50.0 would indicate a shift into positive territory and signal the end of the recent 20-day downtrend. This shift could attract new capital and trading interest, boosting bullish sentiment.
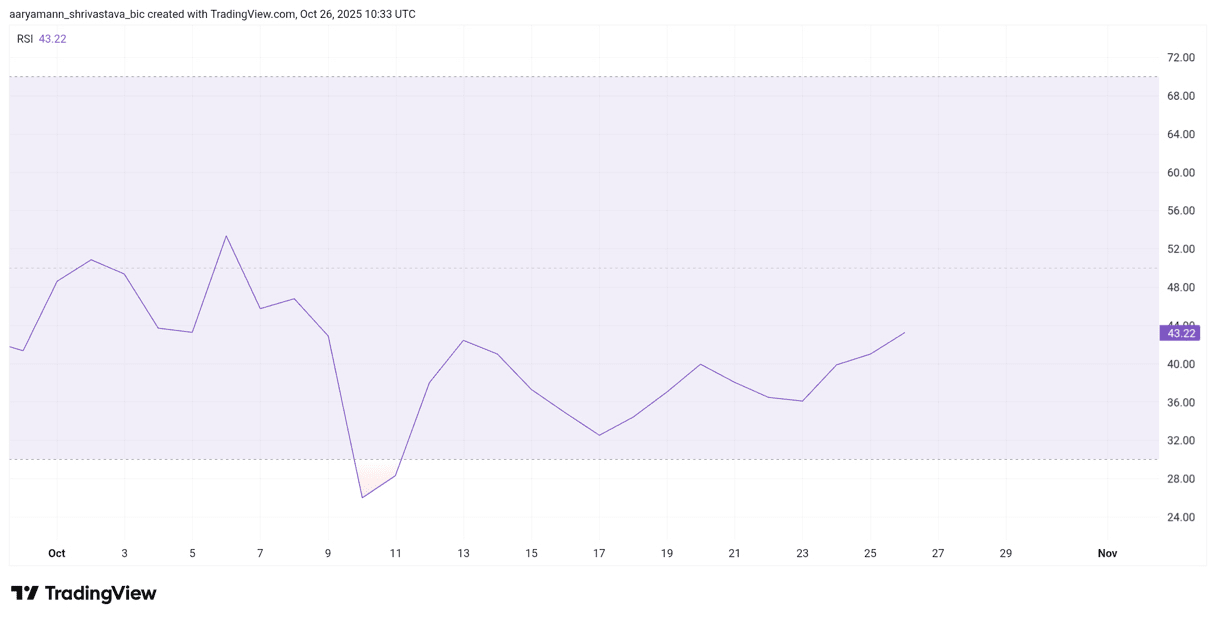
HBAR RSI. Source: TradingView
The Moving Average Convergence Divergence (MACD) adds further weight to this potential reversal. In the short term, the MACD has just formed a bullish crossover, with the indicator line crossing above the signal line. This is a classic sign of fading bearish momentum and increasing buying interest.
Such a crossover often precedes a price rebound, indicating that market sentiment is turning more positive. The shift suggests that HBAR is beginning to align with broader market signals that support a risk-on environment. If momentum continues to build, the digital asset may enter a stronger accumulation phase.
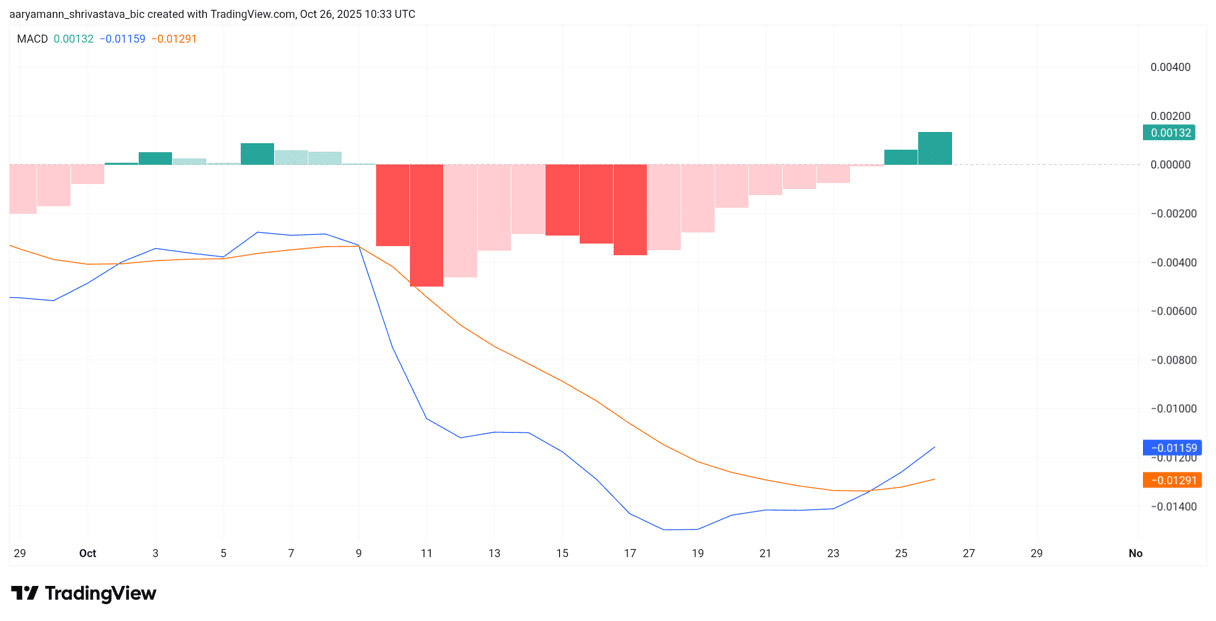
HBAR MACD. Source: TradingView
The price of HBAR could break through
Currently, the price remains consolidated between $0.178 and $0.162. For the altcoin to start a clear breakout, it must close above resistance at $0.178. Doing so would open the way towards the psychological barrier of $0.200, confirming a potential bullish trend.
To reach $0.200, a 13.6% increase from current levels will be required. The bullish crossover on the MACD and rising RSI indicate that this move is achievable, provided investor participation continues.
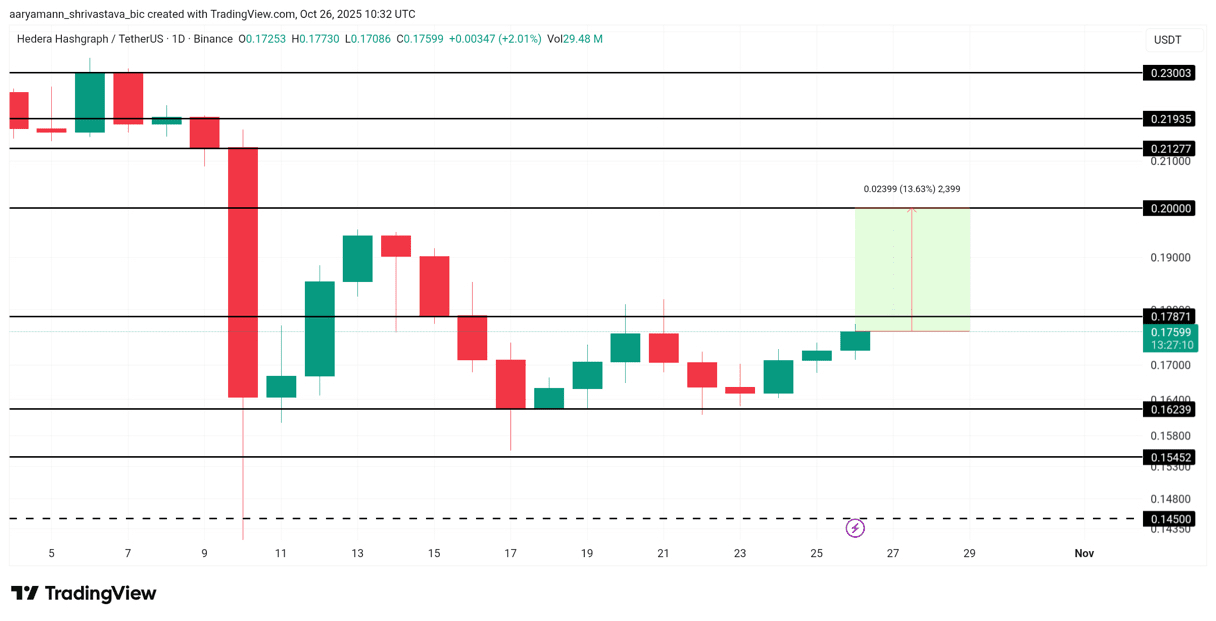
HBAR price analysis. Source: TradingView
However, if selling pressure returns, it may retest support at $0.162, extending the consolidation phase. A breakdown below this level could invalidate the bullish thesis, pushing prices down to $0.154 and indicating renewed weakness.
#HBARPrice #HBAR #BinanceSquareFamily #BinanceSquare #Write2Earn