
After adjustment $BTC , $SOL faced strong selling pressure, breaking the short-term accumulation zone and establishing new lower lows. Bears are completely in control of the game in the short term.

🔷 Anatomy of the Crash: Breaking Down the Structure
4H Frame:
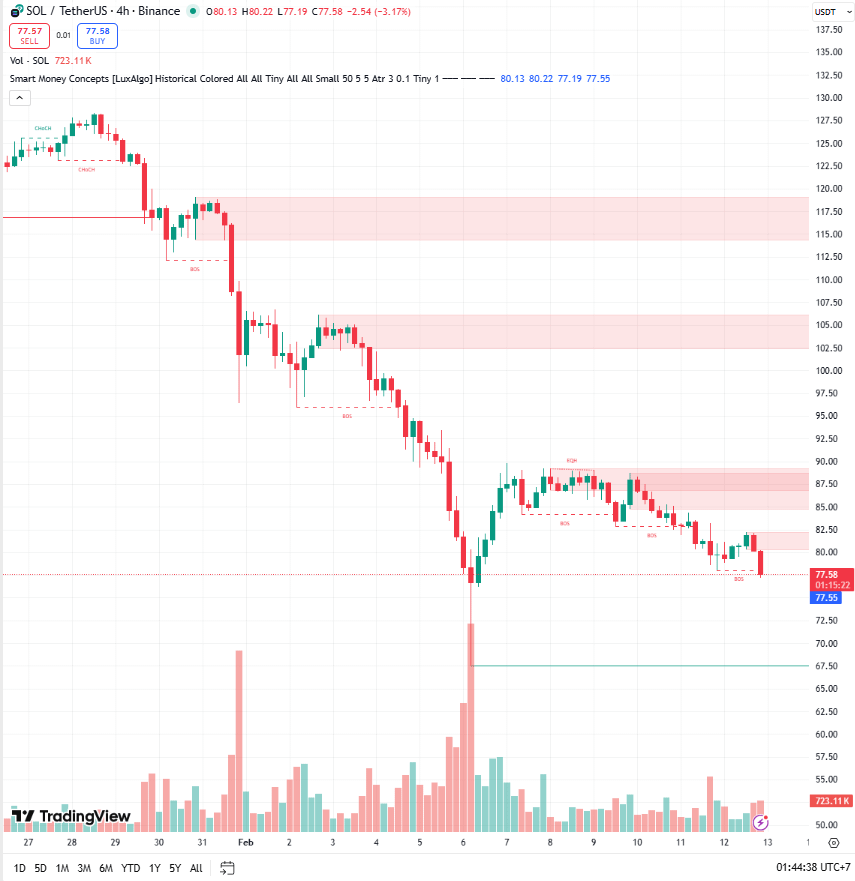
The bearish structure is evident. Prices continuously create lower highs and lower lows.
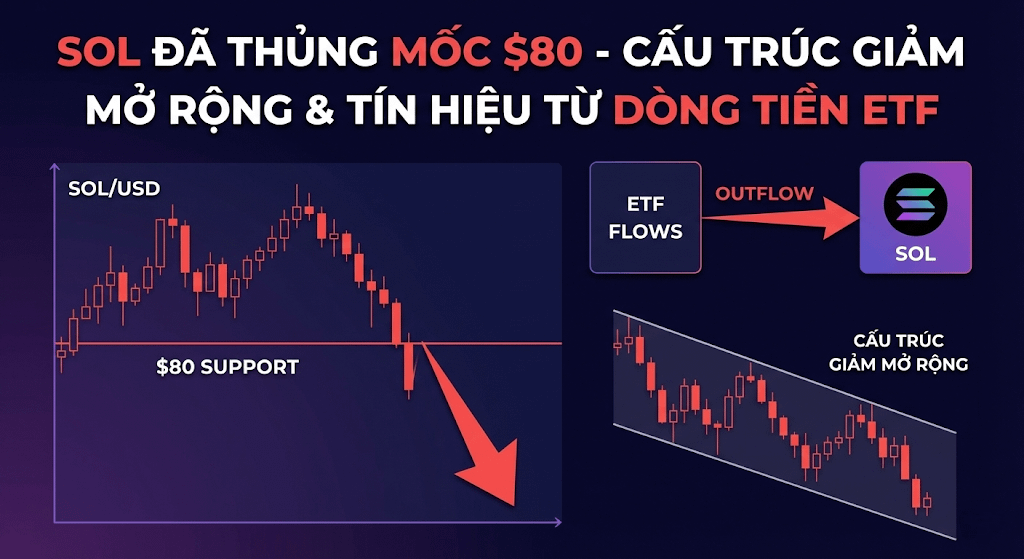
The latest crash pushed the price from the $82.00 area through the psychological support of $80.00 to a low of $77.19.
1H Frame - Short-term:
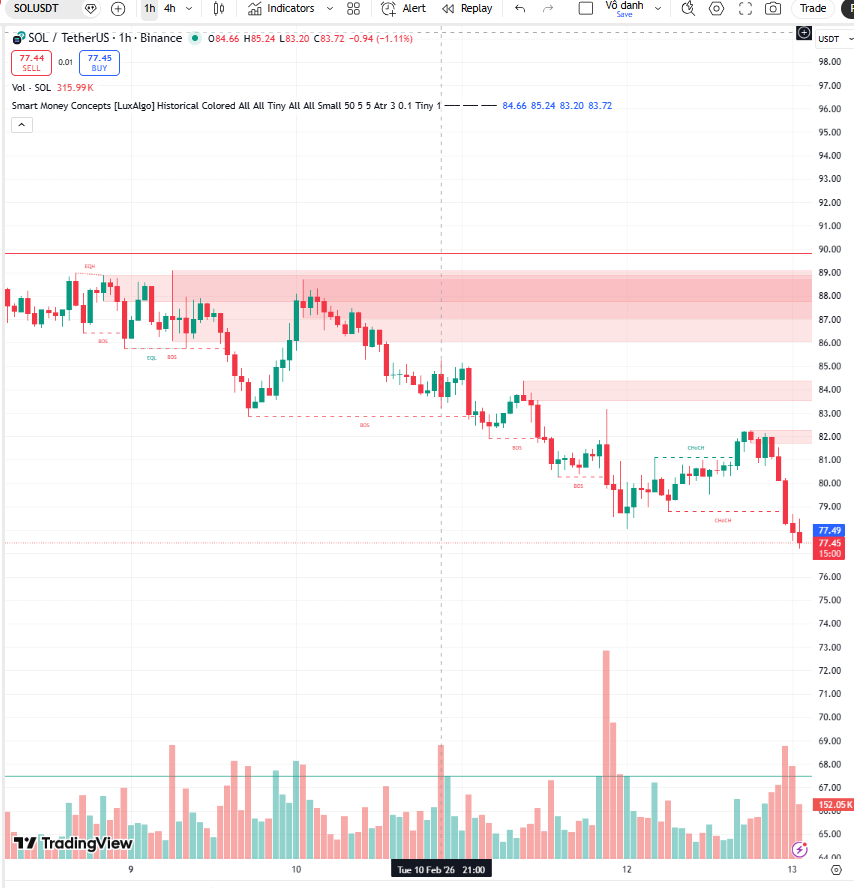
After attempting to recover to the $82.00 area, SOL was sharply rejected.
A large volume sell-off candle triggered a continuing decline, confirming the downward BOS trend.
Next support:
On the 4H frame, if the $77.00 area cannot be held, the next trough that the price may seek is the very deep Demand Zone at $67.50.
🔶 Liquidity Heatmap: Is a Short Trap Forming?
The liquidation heatmap reveals the positions of the parties:
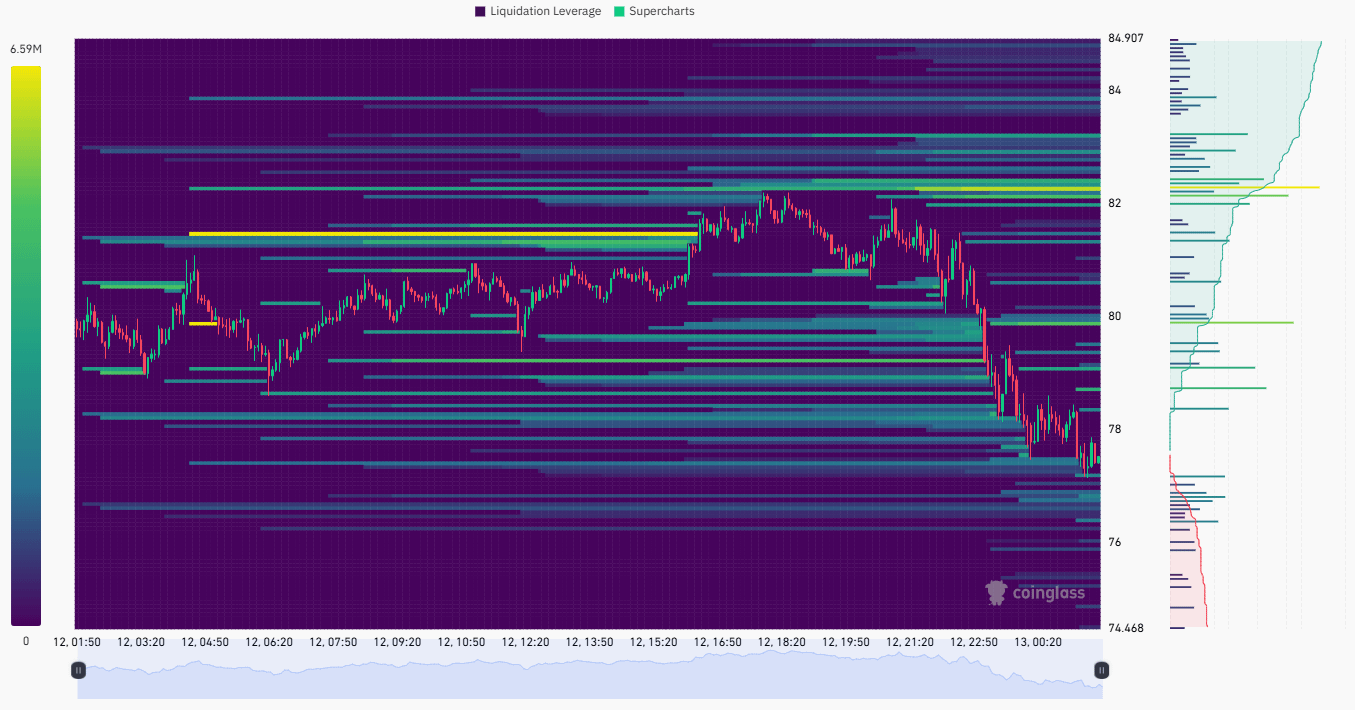
Longs have been purged:
The liquidity band below from $82 to $77 has been completely cleared.
Currently, the Long liquidity below is quite thin, only sporadically present around $76.00.
This means that the momentum for the Market Maker to push deeper immediately is decreasing.
Shorts are accumulating:
Conversely, a brilliant yellow liquidity wall is forming above at the $81.50 - $82.50 range.
This is the stop loss for those who just chased Short.
The market tends to recover to the highest liquidity area. Therefore, the likelihood of SOL having a bounce back to $82.00 to liquidate this Short position is very high before deciding on the next trend.
🔷 Rare Bright Spot: ETF Cash Flow Against the Tide
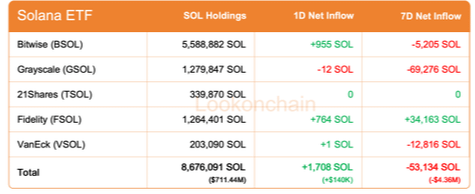
An interesting piece of data is that on 12/02, when BTC ETF funds and $ETH experienced massive capital outflows, SOLETF recorded positive cash flow.
Although the number is small, it indicates that Smart Money is starting to gently accumulate SOL at this price level, considering it an attractive discount.
🔮 Trend Prediction & Trading Scenarios
SOL is in the sensitive area of $77.50. The risk of further decline still exists, but the opportunity for a technical recovery is becoming clearer.
📉 Scenario 1: Continued Downtrend
Condition: 4H close price below $76.50 Break below the previous candle's low.
Development: Panic Sell triggers. Price will slide down to the strong support area of $67.50.
Action: Absolutely do not catch the bottom if the price breaks below $76.
📈 Scenario 2: Recovery to Clear Shorts
Condition: Price holds above $77.00 and forms a double bottom pattern on the 15m/1H frame.
Development: Price bounces back to test the Supply area of $81.50 - $82.50.
Action:
Short Long - Scalp: Entry $77.20 - $77.60. Stoploss $76.40. Target $81.50.
Main Short Strategy: Wait for the price to bounce back to $81.50 - $82.00 to Short in line with the main trend.
The SOL market is under strong selling pressure according to the overall market structure.
However, the accumulation of Short liquidity thick above $82, combined with light net buying signals from ETFs, suggests that a short-term Short Squeeze may occur before the market declines deeper.
Prioritize capital preservation and wait for a reaction at the $77.00 mark.
This article is for reference only and is not investment advice. Please read carefully and consider before making a decision.