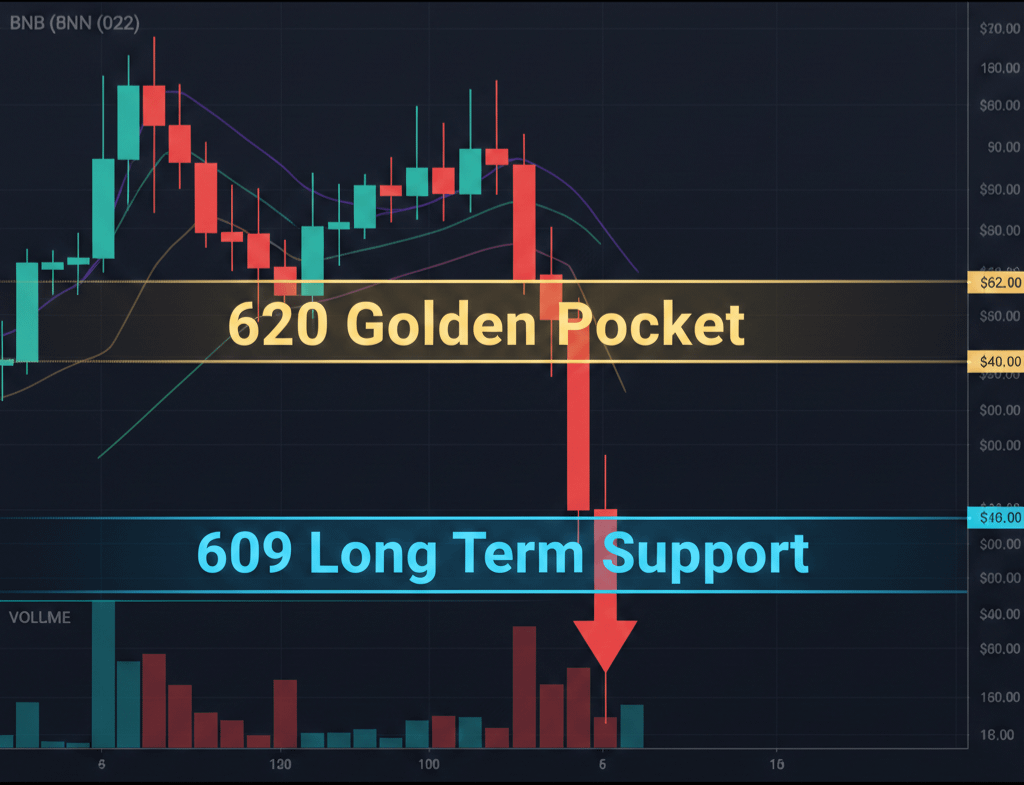
$BNB is currently hovering near $609 after losing the key $620 golden pocket zone, with price now pressing against major long-term support.
Summary
Price has slipped below the $620 Fibonacci 0.618 golden pocket and is now hovering around the 200-week moving average, a major long-term support zone.
The overall structure is still holding, but bulls must push back above $620 to regain control.
Binance ($BNB) is back at a key turning zone after dropping below the $620 area that previously served as strong higher-timeframe support. After several weeks of pullback, price paused at the 0.618 Fibonacci level before edging lower and now trades around $609.
This price action slightly changes the technical picture. Instead of firmly defending support, $BNB is now testing the lower edge of a key confluence area.
Whether this turns into a quick sweep below support or a move into a deeper consolidation range will likely shape the next few weeks of trend direction.
$BNB price key technical points
$620 remains the high-timeframe golden pocket (0.618 Fibonacci retracement)
Price is hovering around the 200-week moving average
A reclaim of $620 would strengthen the bullish case
Sustained acceptance below opens the door to further downside exploration
$BNB price slips below $620 golden pocket, now testing long-term support near $609
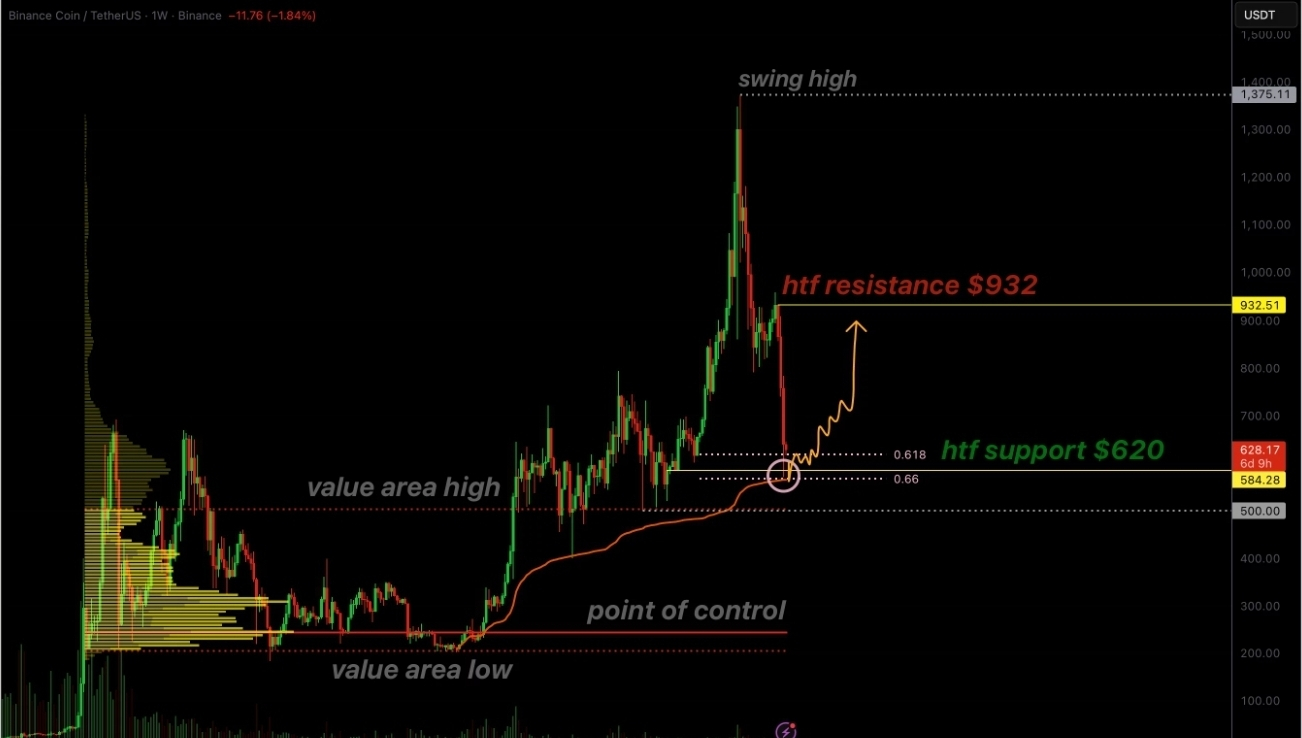
The $620 zone still holds strong technical significance, aligning with the 0.618 Fibonacci retracement of the larger move — commonly called the golden pocket, where price often finds major reactions.
Now that $BNB is trading beneath it, attention turns to whether this dip is just a quick shakeout for liquidity or the start of a real breakdown.
Price is also sitting close to the 200-week moving average, a key long-term trend level traders closely watch. In the past, holding above it has led to rebounds, while staying below has usually meant longer consolidation phases.
That makes the upcoming weekly closes especially important for what comes next.
Market structure supports a potential bottom
Looking at the bigger market picture, $BNB hasn’t confirmed a full trend reversal yet. Dropping below $620 weakens near-term bullishness, but the coin hasn’t clearly fallen into lower macro levels.
This kind of dip under support before bouncing back is typical in bottoming phases, where markets often shake out liquidity before moving higher.
If buyers drive $BNB back above $620 with strong volume, it could be seen as a temporary deviation, keeping the larger bullish trend intact. If not, a deeper consolidation phase becomes more likely.
Upside targets are now back on the radar.
Bullish scenario:
Regain and maintain price above $620
Achieve a solid weekly close within the golden pocket
Slowly move toward higher resistance levels
$932 stays the main long-term resistance to watch
Bearish scenario:
Weekly closes keep falling below $620
Break below the 200-week moving average
Increase in selling pressure
Possible drop toward lower price zones before forming a new base
What to watch next:
The $932 high-timeframe resistance remains the main upside target if the overall macro structure holds. But bulls first need to reclaim $620 to keep that target in play.
With $BNB trading near $609, this isn’t just a pause anymore it’s a test of support.
Long-term setups require patience. The next weekly closes will show if this is a true breakdown or just a temporary dip below major support.
Right now, the bigger structure is pressured but intact. A strong move back above $620 would restore bullish momentum, while failure could mean extended consolidation before any significant upside.