Right now Bitcoin is trading around 65,800 to 66,000 area and most people are confused. Some think the bull run is finished. Some think a deeper crash is coming. But when I look at the chart calmly it does not look like death. It looks like a trap.
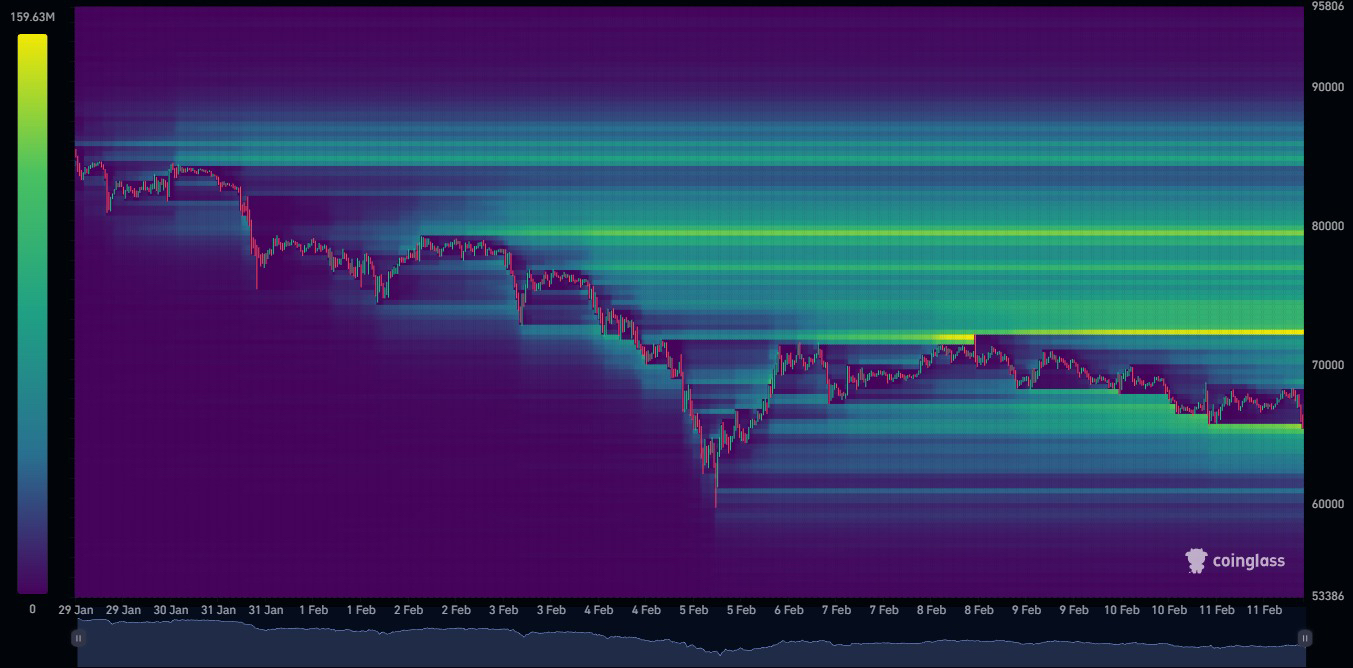
If you study this heatmap carefully you can see large liquidity sitting above 70,000 and also below 60,000. This tells me the market makers have space to hunt both sides. When liquidity builds like this price usually moves aggressively to grab positions before choosing real direction. That is why I call this a trap zone. Late longs and late shorts both can get punished here.
Now look at the weekly structure.
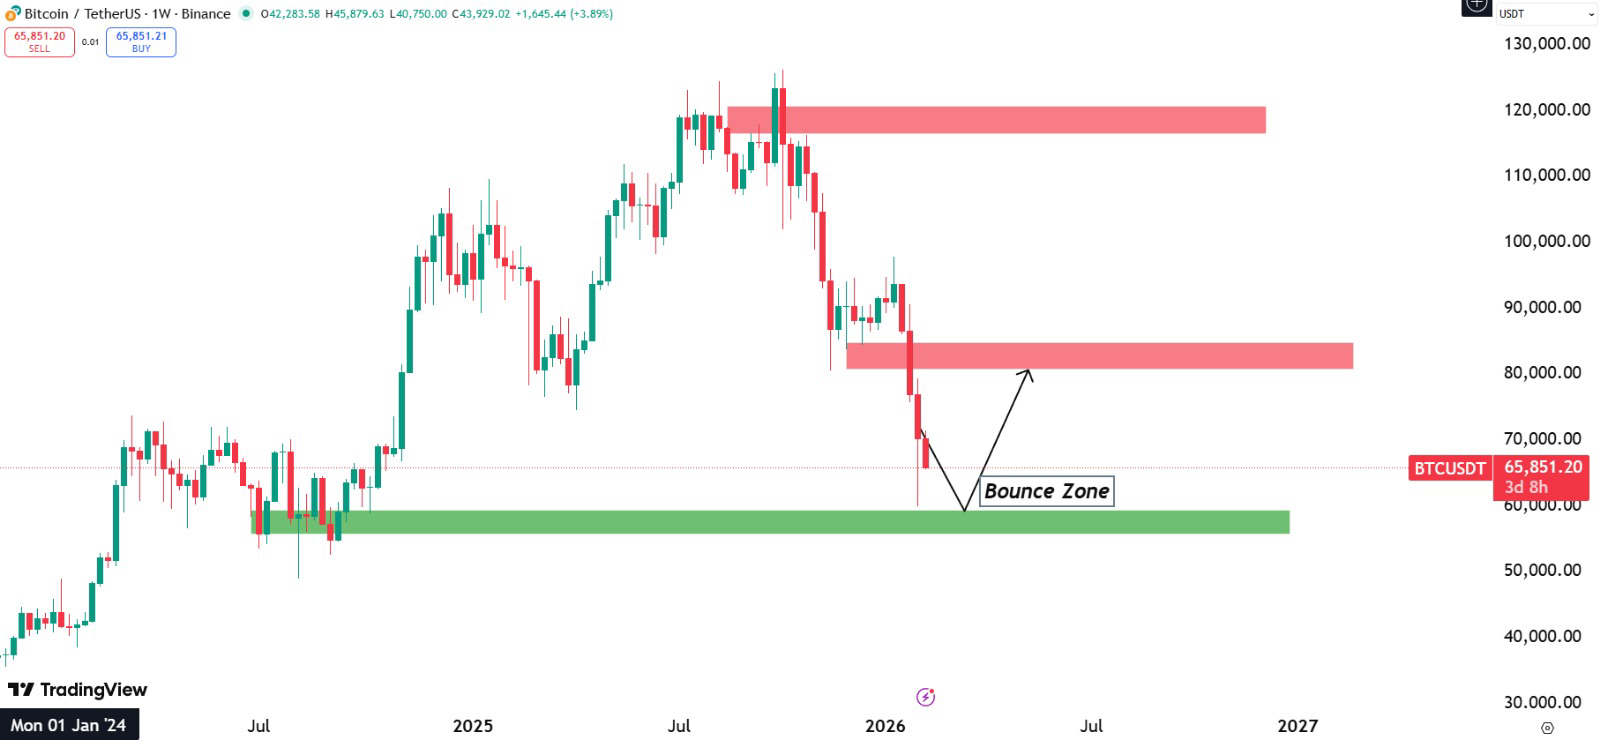
From the chart we can clearly see price rejected near 120,000 area earlier in the cycle and then dropped strongly. Now price is reacting near the 60,000 to 62,000 green demand zone. This area has acted as strong support before. Current candles show reaction and attempt to stabilize above 65,000. Structurally this is not a collapse yet. It is a retest of a major support area after a huge expansion phase.
When markets correct after big rallies they usually shake confidence first. That is exactly what is happening now. Weak hands exit. Emotional traders panic. But structure wise Bitcoin is still holding above long term breakout levels from previous cycle.
Now the most interesting part is sentiment.
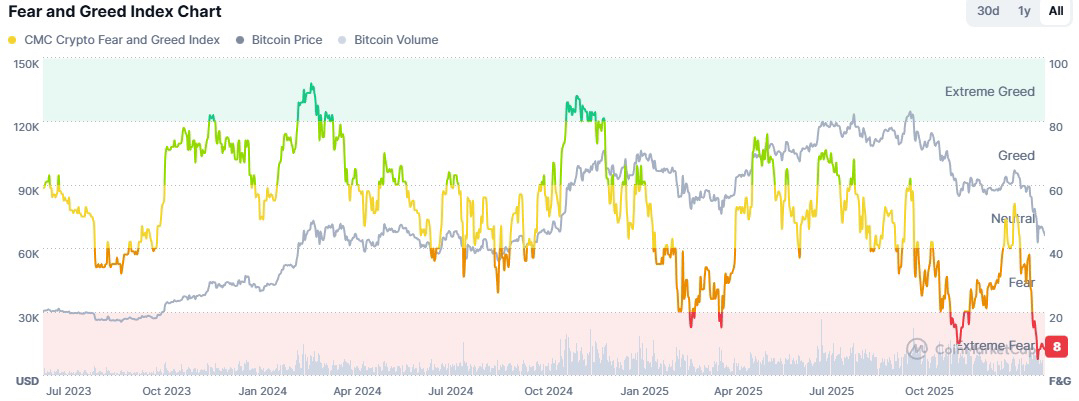
Fear and Greed Index is sitting near extreme fear levels again. Not exactly zero but very close to historical lows compared to recent months. Every time sentiment moved close to extreme fear during an overall bullish macro structure Bitcoin later delivered strong upside performance.
Think back.
In 2013 after deep fear it exploded.
In 2018 after brutal capitulation it rebuilt quietly and then 2020 rally started.
In 2022 when everyone believed crypto was finished price slowly accumulated and then surprised the market.
Extreme fear usually appears near opportunity zones not near tops.
Right now price near 65,800 while fear is near bottom levels tells me sentiment is worse than structure. That mismatch is important. When emotion is more negative than technical damage big moves often follow.
This does not mean price cannot sweep 60,000. It can. Trap zones often include fake breakdowns. Liquidity below support is attractive. But historically when fear touches these levels and higher time frame support holds market performance afterward has been outstanding.
People are again saying it is over. The same cycle psychology repeats. When price was near 100,000 everyone wanted more. Now at 65,000 most are afraid. The asset did not change. Emotion changed.
From my view this area between 60,000 and 70,000 is a decision zone. If price reclaims 70,000 strongly next liquidity magnet sits near 80,000 to 85,000 zone shown on the chart. If it loses 60,000 cleanly then deeper retracement could open. But as long as major demand holds this still looks like a corrective phase not a market death.
Markets reward patience more than panic. Fear at lows and greed at highs has been repeating for more than a decade in Bitcoin history. Whenever sentiment collapsed while structure stayed alive the following months surprised most participants.
Right now we are again in that emotional storm. Question is simple.
Are you reacting to fear Or are you studying the structure behind it
Because trap zones are built to confuse the majority. And strong trends usually continue after maximum confusion.
#bitcoin #CZAMAonBinanceSquare #USNFPBlowout #USRetailSalesMissForecast #WhaleDeRiskETH
