BTC Macro Cycles Duration: 1064-Day Bulls & 364-Day Bears)
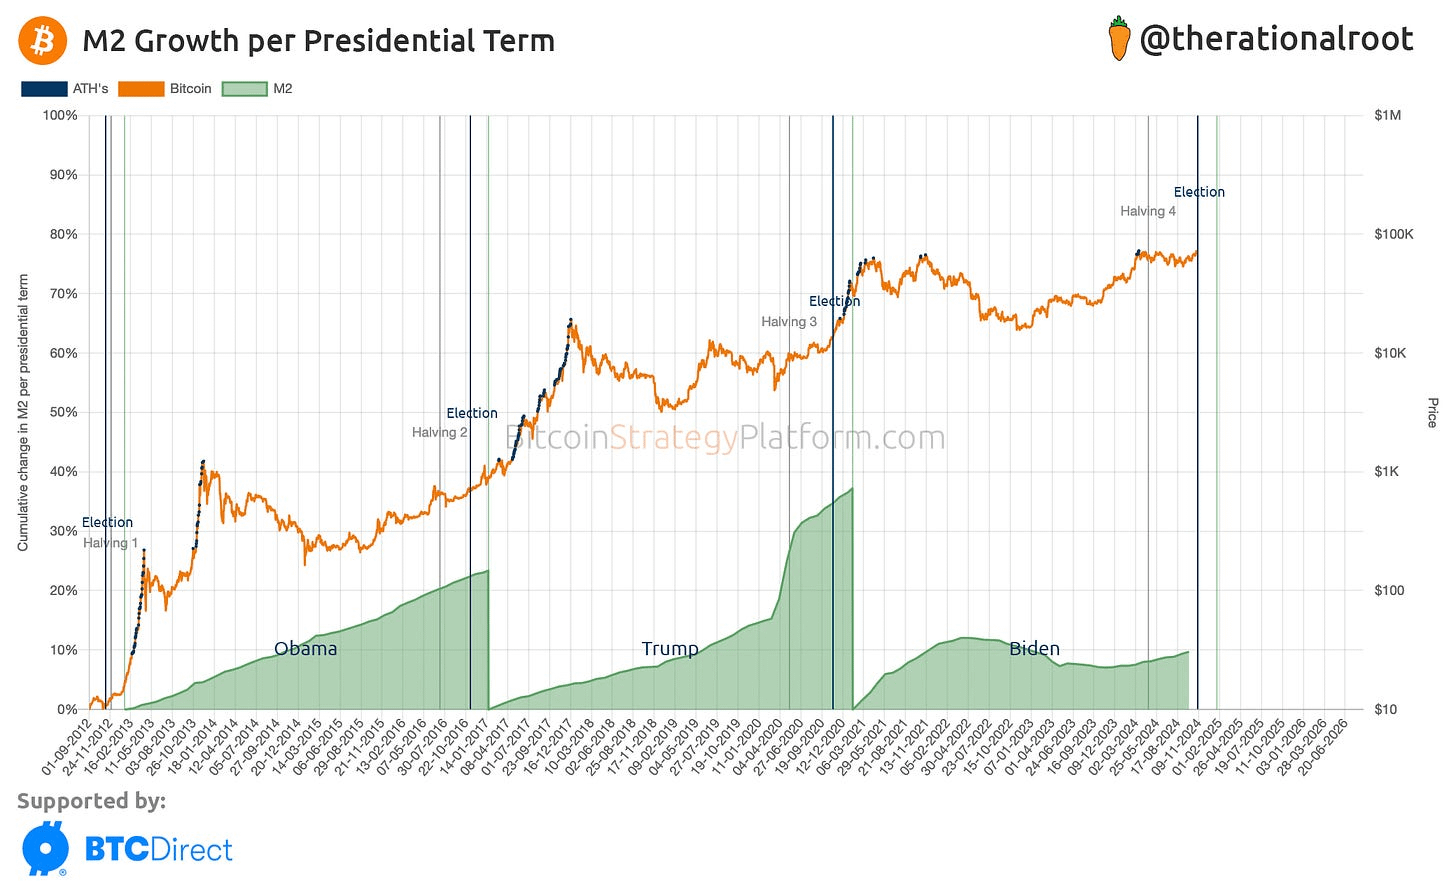
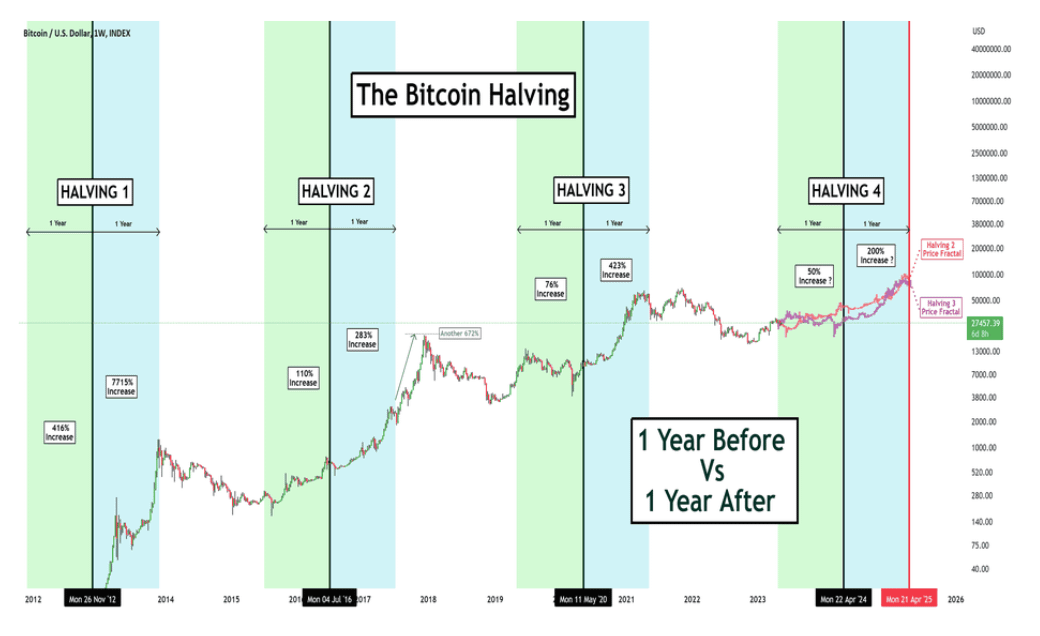
Bitcoin's macro cycles have long fascinated traders and analysts, often tied to the halving events that occur roughly every four years, reducing the block reward and historically sparking bull markets due to increased scarcity.
The provided chart from TradingView (Bitcoin/USDT on a 1-month timeframe from Binance) highlights a repeating pattern in Bitcoin's price action across multi-year periods:
2018–2021 bull cycle: Lasting approximately 1,064 days, featuring a strong upward trend.
2021–2022 bear cycle: Around 364 days of correction.
2022–2025 bull cycle: Mirroring the prior bull with 1,064 days.
2025–2026 bear cycle: Projected at 364 days.
2026–2029 bull cycle: Anticipated to follow suit with another 1,064 days.
This suggests a potential symmetrical 4-year cycle structure, with bull phases roughly three times longer than bears, aligned with halving-driven supply dynamics.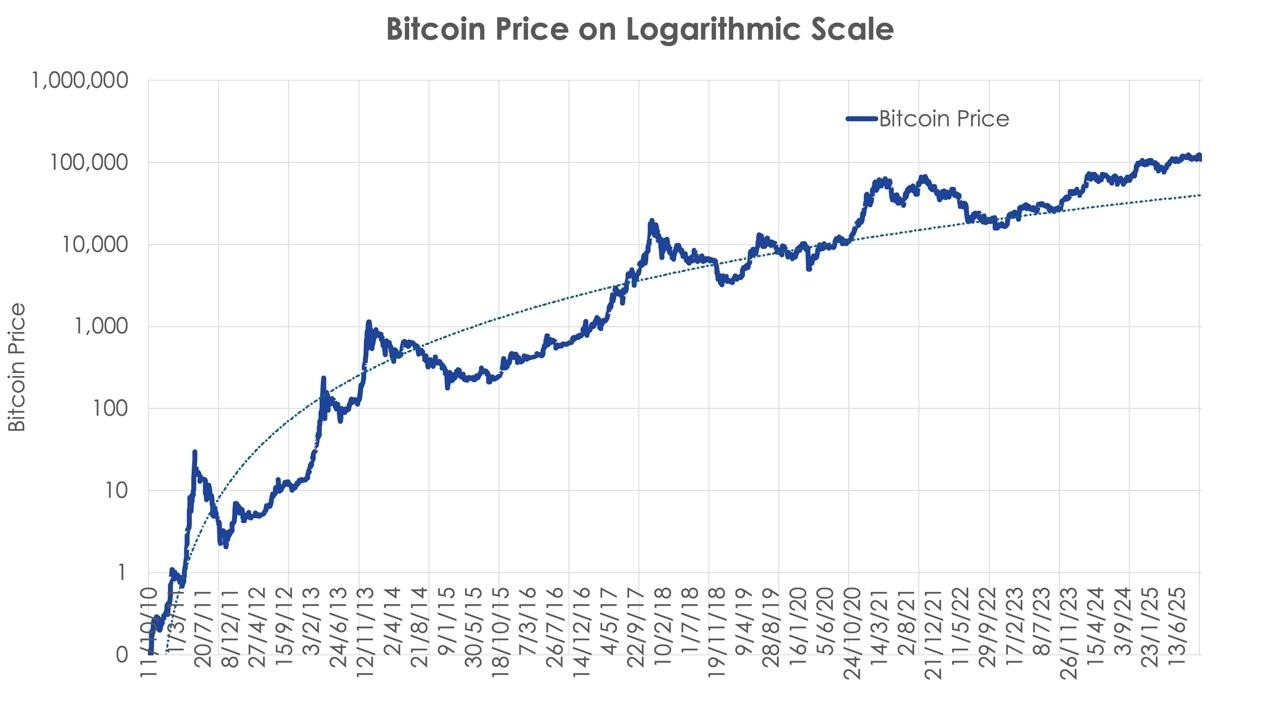
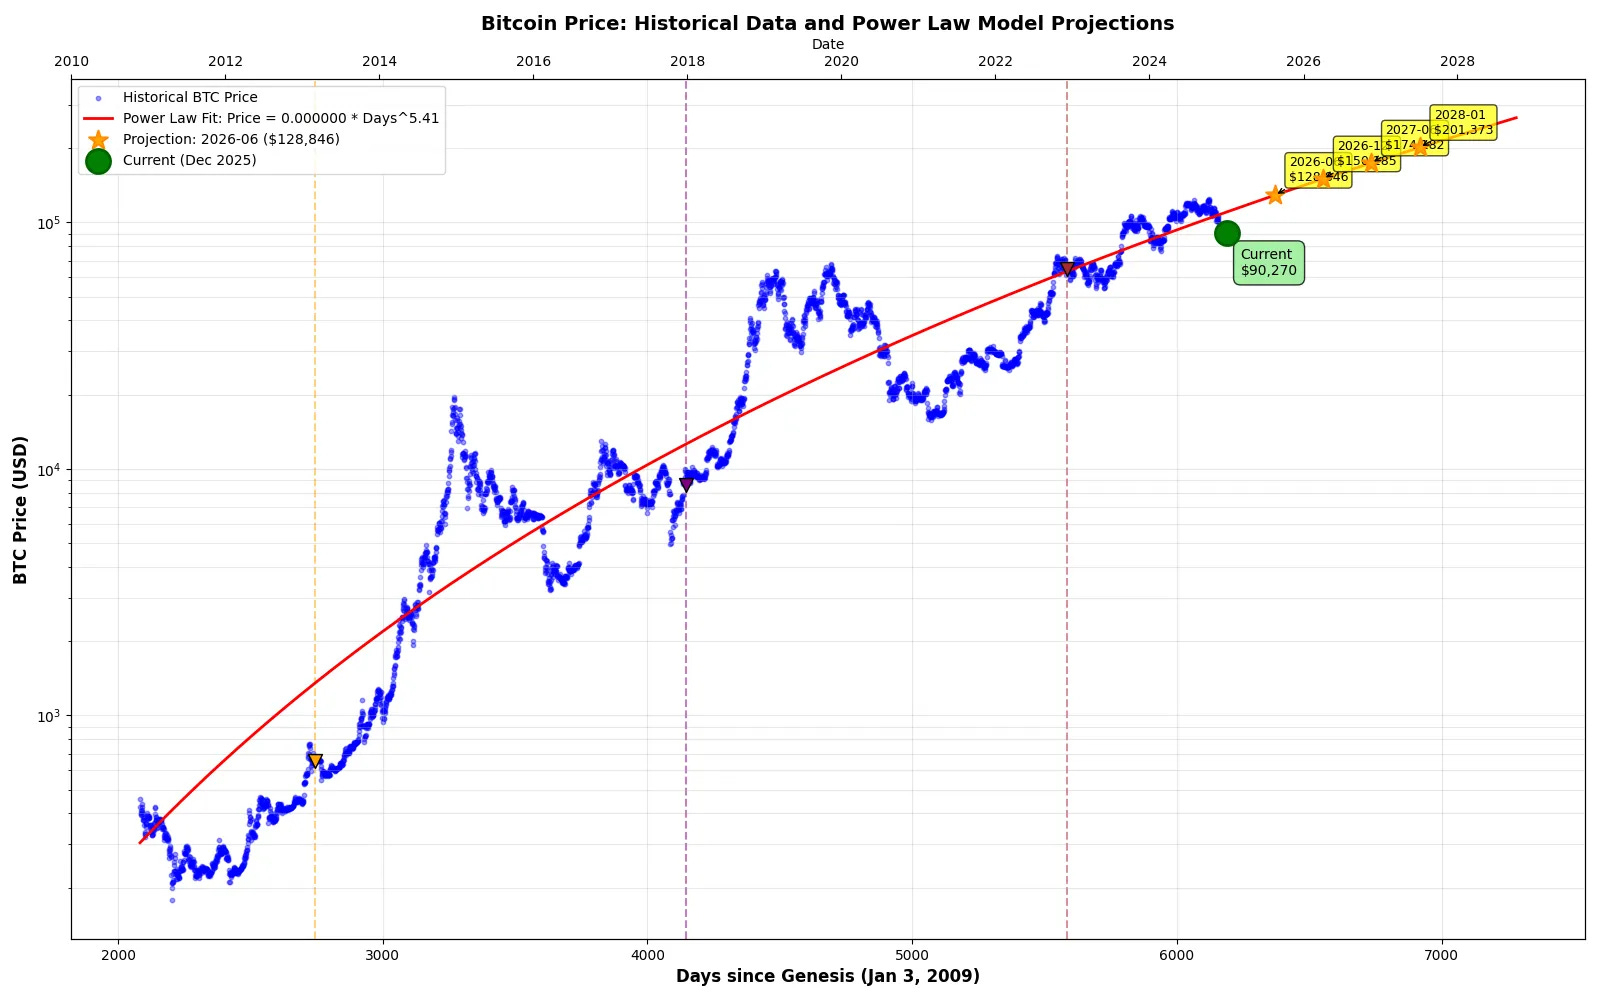
As of mid-February 2026, Bitcoin trades around $67,000–$68,000, showing consolidation after a peak near $126,000 in late 2025. This aligns with some cycle theories suggesting the 2025 peak marked the end of the post-2024 halving bull, transitioning into a corrective bear phase in 2026.
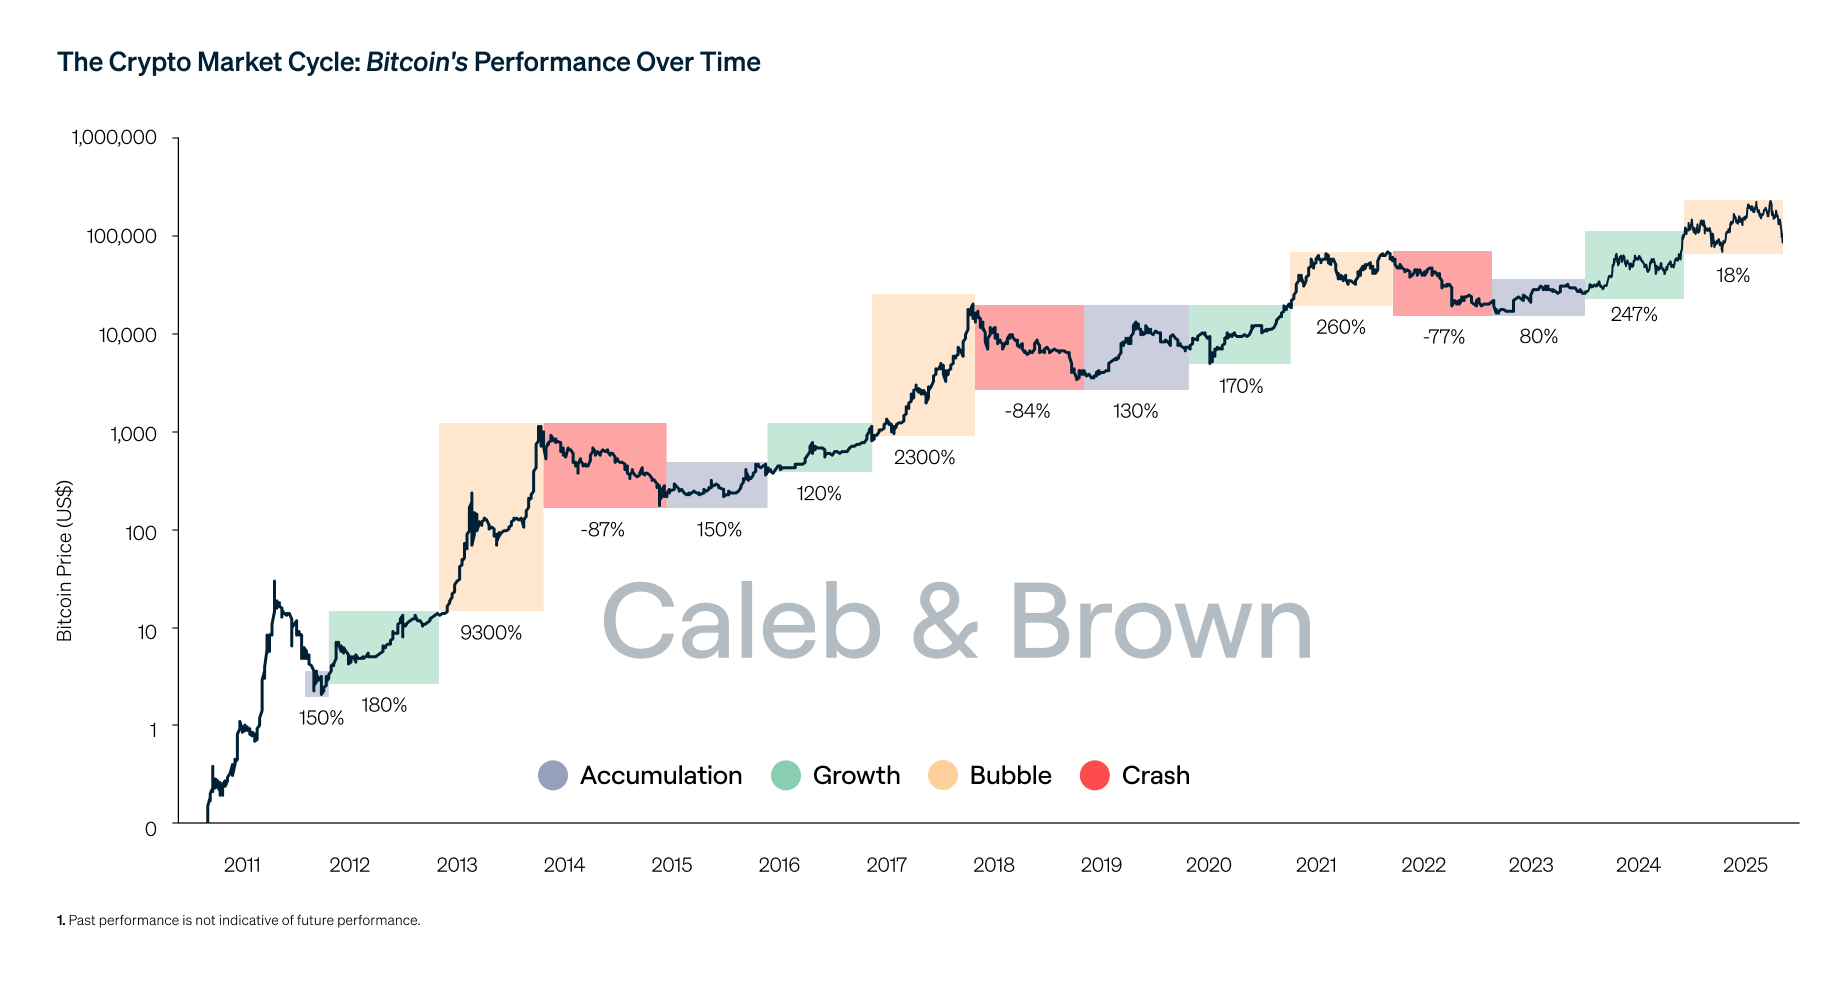
Historical data supports diminishing drawdowns in later cycles (e.g., ~77–85% drops in earlier bears, potentially shallower now due to institutional adoption and ETFs). However, debates persist on whether the classic 4-year cycle is "broken" or evolving, with some models projecting a 2026 low in the $55,000–$65,000 range before the next upswing toward 2029.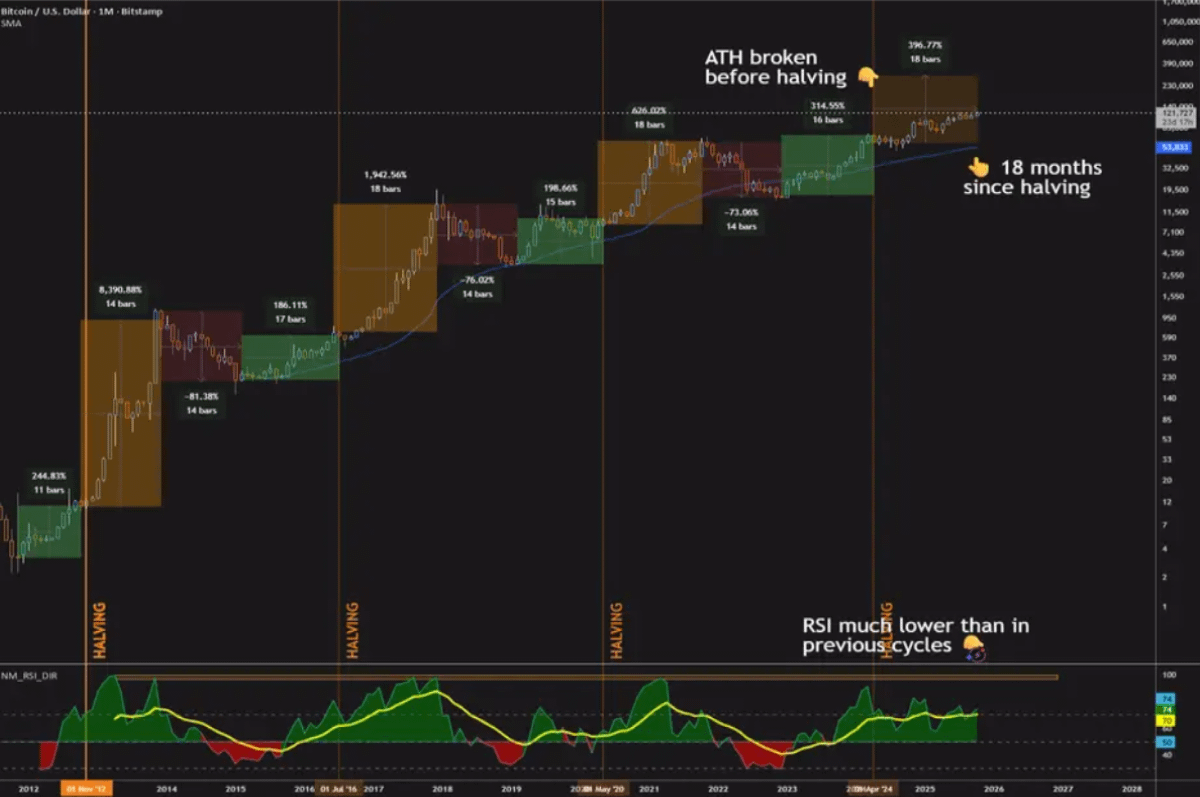
The cycle hypothesis remains popular but is not guaranteed—Bitcoin's maturation, regulatory shifts, and macroeconomic factors could alter patterns. Always conduct your own research; past performance does not predict future results.
What are your thoughts on this cycle projection—still holding strong, or has institutional involvement changed the game? 🚀
