

Stablecoin dominance near cycle levels is worth watching closely, USDT.D (Tether dominance, calculated as the ratio of USDT's market capitalization to the total cryptocurrency market capitalization) has reached levels that recall previous major turning points in Bitcoin cycles
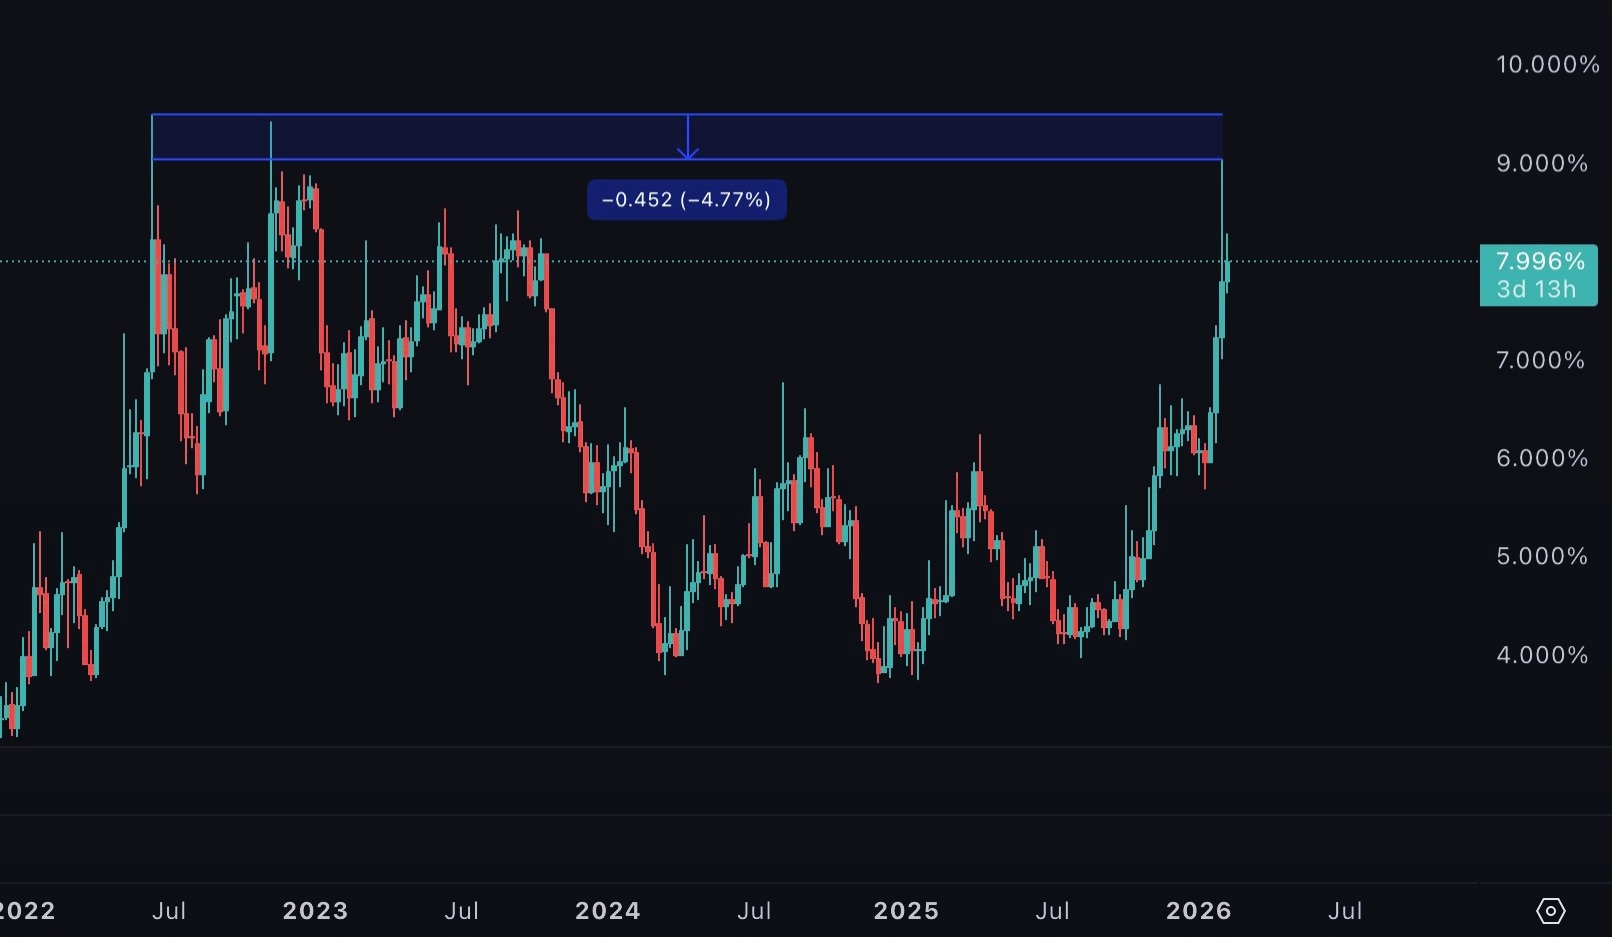
As of February 2026, USDT.D stands at approximately 7.996% (with recent fluctuations around 8.00%–8.02% according to TradingView data), recording a notable rise amid Bitcoin's correction from previous peaks, as the chart shows a slight drop of -0.452 (-4.77%) from a nearby higher level, yet it remains in a relatively elevated range
This indicator is a powerful measure of market sentiment: rising stablecoin dominance reflects capital moving from high-risk assets (such as BTC and altcoins) into safe havens like USDT, indicating fear, capitulation, or defensive positioning
Historically, peaks in USDT.D coincide with Bitcoin cycle bottoms, where investors hold their funds in stablecoins before re-entering risky assets during recovery
A prominent observation: USDT.D has now reached a point just 5% below the level it hit when Bitcoin bottomed in November 2022
During the FTX collapse and the bear market low, USDT.D peaked in the approximate range of 8.50%–9.00% (often referred to as ~9% or slightly higher in analyses), exactly when BTC formed a multi-month bottom near $15,700
That peak represented extreme fear and liquidity drain, followed by a sharp reversal: dominance declined, capital returned to the market, and Bitcoin rose to over $31,000 by early 2024, with additional gains thereafter.In the current context (February 2026), the weekly/daily chart of USDT.D shows a significant upward move, breaking multi-year descending trendlines and reaching multi-year highs (around 7.4%–8.0%+)
The total cryptocurrency market capitalization has contracted, while the overall stablecoin supply remains elevated (around $307 billion, with USDT dominance ~60%)
This inverse correlation is clear: as BTC declines, USDT.D rises, signaling sidelined liquidity and potential further pressure if dominance approaches the 2022 peak range (8.5%–9.5% in some forecasts)
Why is it worth watching closely?
Cyclical parallels: Stablecoin dominance often peaks at bear market exhaustion
In 2022, the 8.5%–9% range coincided with the final bottom
Current levels (~8%) are approaching the historical “capitulation threshold,” suggesting the market is close (but not yet) to maximum defensive stance
Rejection at resistance or a pullback could indicate rotation back into BTC and altcoins, potentially igniting relief rallies
Liquidity signals: Rising USDT.D alongside falling total market cap means liquidity is draining from risky assets
Analysts see stabilization or decline in dominance as a prerequisite for sustainable recovery, as occurred after 2022
Broader context: Combined with Bitcoin’s weekly RSI dropping below 30 (a rare oversold signal), whale accumulation hints on-chain, and the post-2024 halving correction phase, elevated stablecoin dominance reinforces that we are in a high-fear phase of high uncertainty
Yet history shows these zones frequently precede major reversals rather than endless downside
No indicator is 100% guaranteed—dominance can remain elevated for months in prolonged bear markets, and further downside remains possible if macro pressures intensify
Nevertheless, USDT.D approaching cycle-high territory (just 5% shy of the 2022 bottom peak) makes it a critical level
Watch for rejection at resistance (8.5%–9%), volume shifts, or BTC holding supports—these may signal a shift from capitulation to accumulation.In the cyclical nature of the market, extreme stablecoin dominance has repeatedly signaled bottoms before explosive rallies
If the pattern repeats, this caution phase may soon transition into renewed risk appetite
Stay vigilant: upcoming moves in USDT.D could foreshadow Bitcoin’s path out of the current correction

