

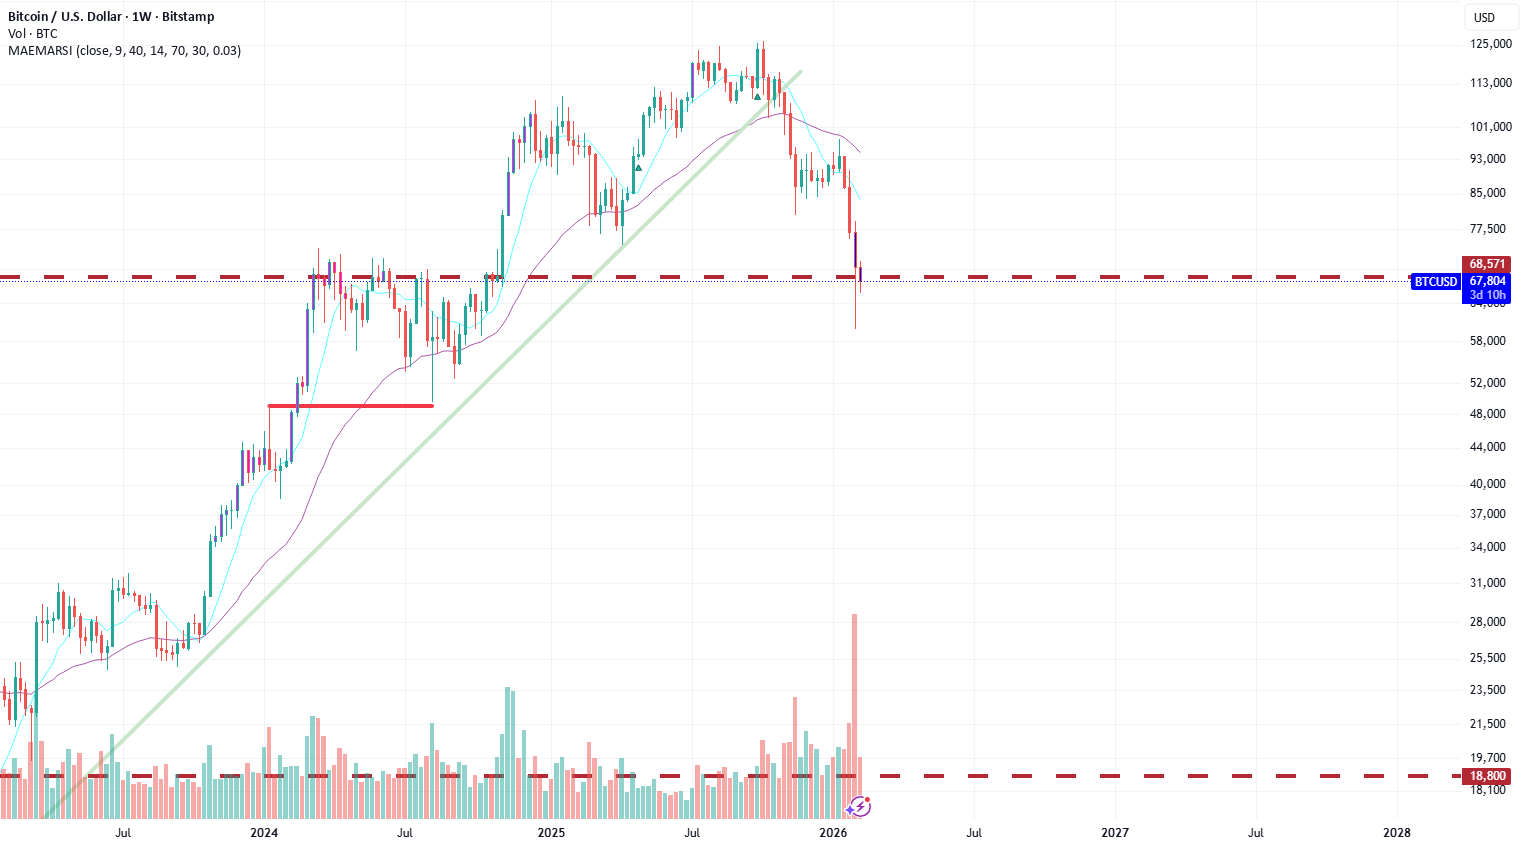
I wrote this indicator in 2014, and has been fairly reliable bottom indicator on the weekly chart. Only 3 prior occasions of the BTC weekly showing blue candles (only occurs when severe oversold and a wide spread between short and long MAs).
Jan 12th 2015
December 10th 2018
June 13, 2022
The first two marked the bottom. June 13, 2022 was close to the bottom with actual bottom coming a few months later at $15,500.
This is now the fourth time we have blue weekly candles on Bitcoin.

BTCUSDT
Perp
67,558
+2.48%