

Bitcoin entering the weekly RSI zone below 30 is a rare and historical signal in the cryptocurrency market ,This technical indicator, measures the strength of price momentum over 14 periods (weekly here), and a reading below 30 is considered severe oversold, meaning selling has exceeded natural limits, potentially opening the door to a reversal or the beginning of a strong accumulation phase
Historically, this situation has occurred very few times in Bitcoin's life, and it has often coincided with the ends of major bear cycles and the start of major accumulation phases that preceded massive rallies
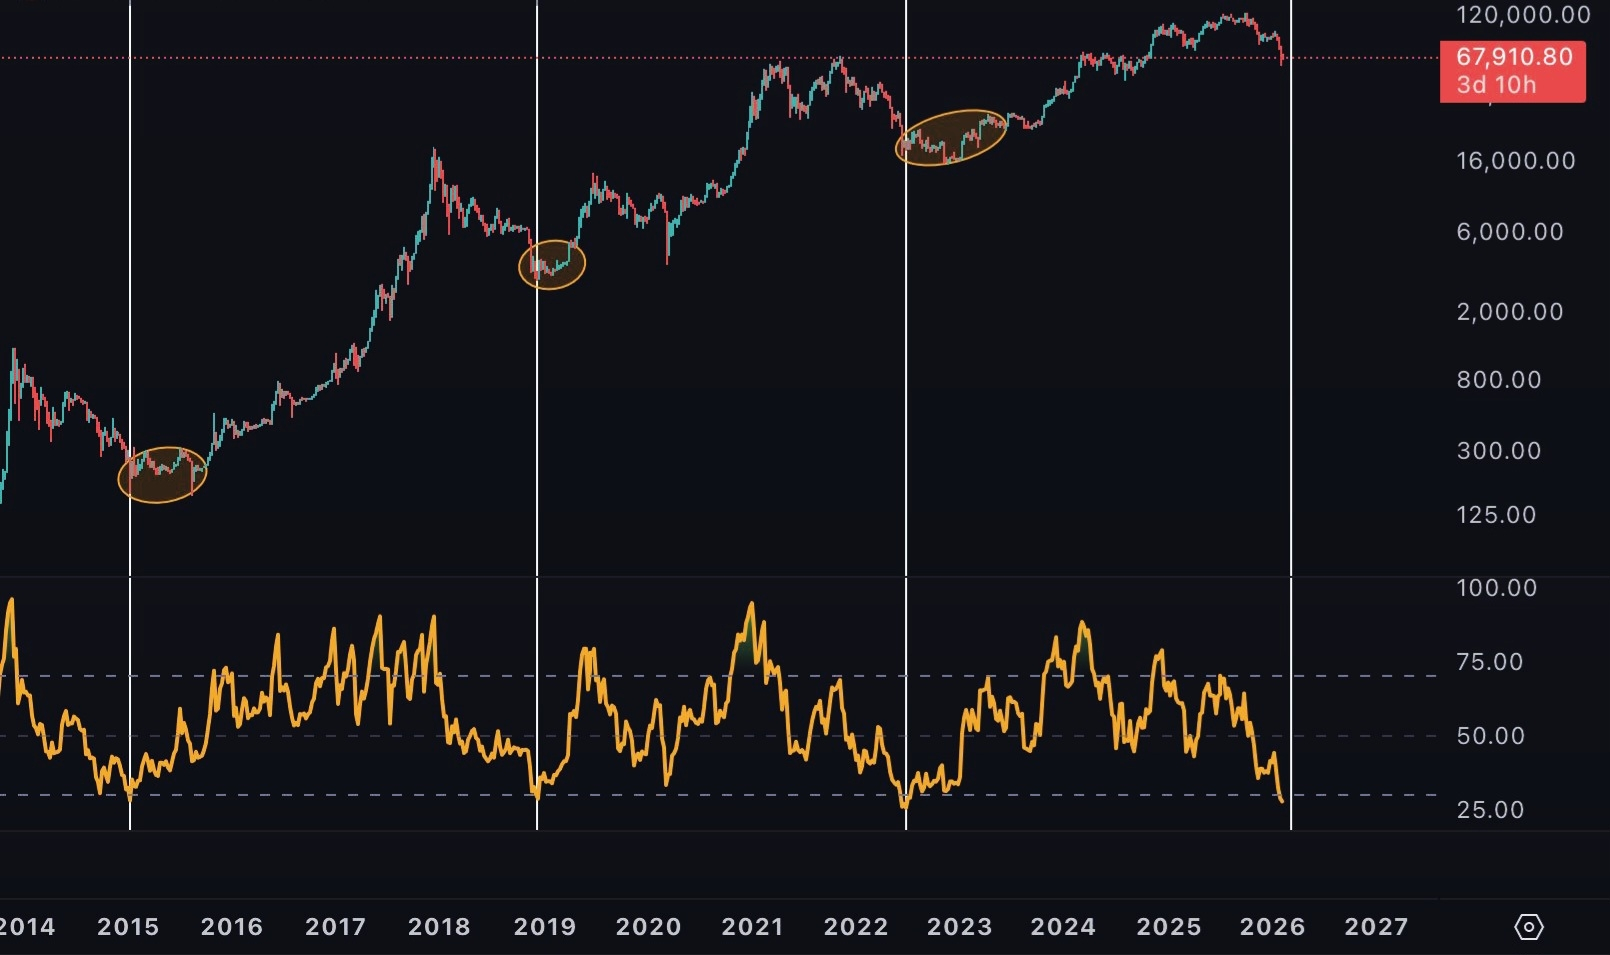
For example: In 2015, the weekly RSI dropped below 30 during the depths of the decline after the 2013-2014 bubble
The price was around very low levels (roughly below $300–400), followed by a long-term accumulation by large investors, leading to the start of the major bull cycle toward $20,000 in 2017
Those who bought on a weekly close with this signal and held for one year achieved returns exceeding +112% in some documented cases
In 2018-2019 (especially late 2018 and early 2019), similar signals appeared near the bottom around ~$3,200
That period was filled with despair and capitulation, but it represented a golden window for accumulation
The result? A massive rally in 2019-2021, delivering +136% within one year from that point in some analyses.
In 2022 (particularly June and November), the weekly RSI reached levels below 30 near the FTX collapse and the bottom around ~$15,600–18,000
Although some periods saw temporary further downside, they signaled the end of the bear cycle and the beginning of accumulation that took the price to new highs in 2024-2025
The one-year return from those signals was +26% in documented cases—lower but still positive despite volatility
Now, in February 2026, the weekly BTC/USD chart shows the RSI entering below 30 once again (possibly the fourth or fifth time in history according to sources), with the price hovering around $67,910 after a sharp correction from previous peaks above $120,000
The chart highlights similar past accumulation zones (such as 2015, 2019, 2022) circled in orange, reinforcing the idea that these zones are often the start of long-term absorption phases
Why is this signal considered the beginning of a major accumulation?
Because it reflects peak fear and capitulation from short-term speculators, while long-term investors (the “whales”) begin gradually buying
On-chain data often shows increased accumulation during these periods, as has happened recently with large whale purchases
Of course, no signal is 100% guaranteed—downside can sometimes continue before reversal (as in 2022)
But history shows that a weekly RSI below 30 rarely appears except at major turning points
For strategic investors, this may be a moment to consider gradual accumulation rather than panic selling
In the end, the digital market runs on cycles, and accumulation follows capitulation
If the historical pattern repeats, we may witness a transition from fear to an accumulation phase that paves the way for a new bull cycle
