 Ethereum has a history of deep corrections followed by explosive recoveries.
Let’s break it down clearly:
2018 → After the 2017 peak, ETH crashed more than 90% into 2018.
Price entered a long accumulation phase before the next expansion.
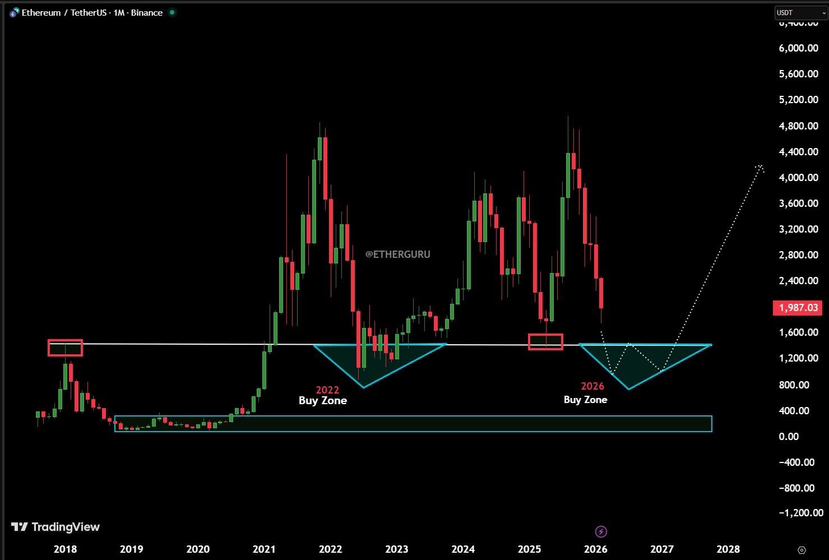
2020–2021 → From the bear market lows, Ethereum rallied aggressively and printed a new cycle high above $4,000.
That move delivered multiple-X returns from the bottom.
2022 → Another brutal breakdown.
ETH collapsed nearly 75–80% from its all-time high and formed a major bear market bottom.
Sentiment was extremely negative during this period.
2023–2024 → Recovery phase.
Ethereum rebounded strongly from the 2022 buy zone and rebuilt bullish structure.
2026 → Once again, price has dropped sharply from cycle highs.
The structure now mirrors the 2022 setup — deep correction, long-term support test, compression near a historical demand zone.
Pattern similarity:
• Major peak
• Sharp selloff
• Extended base formation
• Sentiment collapse
• Gradual stabilization before expansion
Historically, every time #Ethereum formed this type of structure, it marked a long-term accumulation area — not the end of the cycle.
If history continues to rhyme, 2026 could represent another high-probability reset zone before the next expansion phase begins. $ETH
