Simple signs that can help you spot 2x–5x NFT movesMost people lose money in NFT flipping because they buy due to hype (FOMO) and sell in panic. Smart flippers don’t guess — they watch data, especially floor price and trading volume.Using the indicators below, you can often spot a strong NFT collection 2–4 weeks before a pump
Indicator 1: Floor Price Stays Strong When Market Falls
When the overall NFT market drops 20–30%, look for collections whose floor price does not fall much.
This shows:
Strong holders
Real demand
Confidence in the project
Example:
In January 2026, when the NFT market crashed, Azuki dropped only from 12 ETH to 10.5 ETH (about 12%). Other big projects fell 25–30%.
Azuki holders stayed calm and held their NFTs. After 3 weeks, Azuki went up to 15 ETH, giving a 42% gain from the bottom.
👉 Stable floor during bad market = strength.
Floor Price vs Volume Correlation
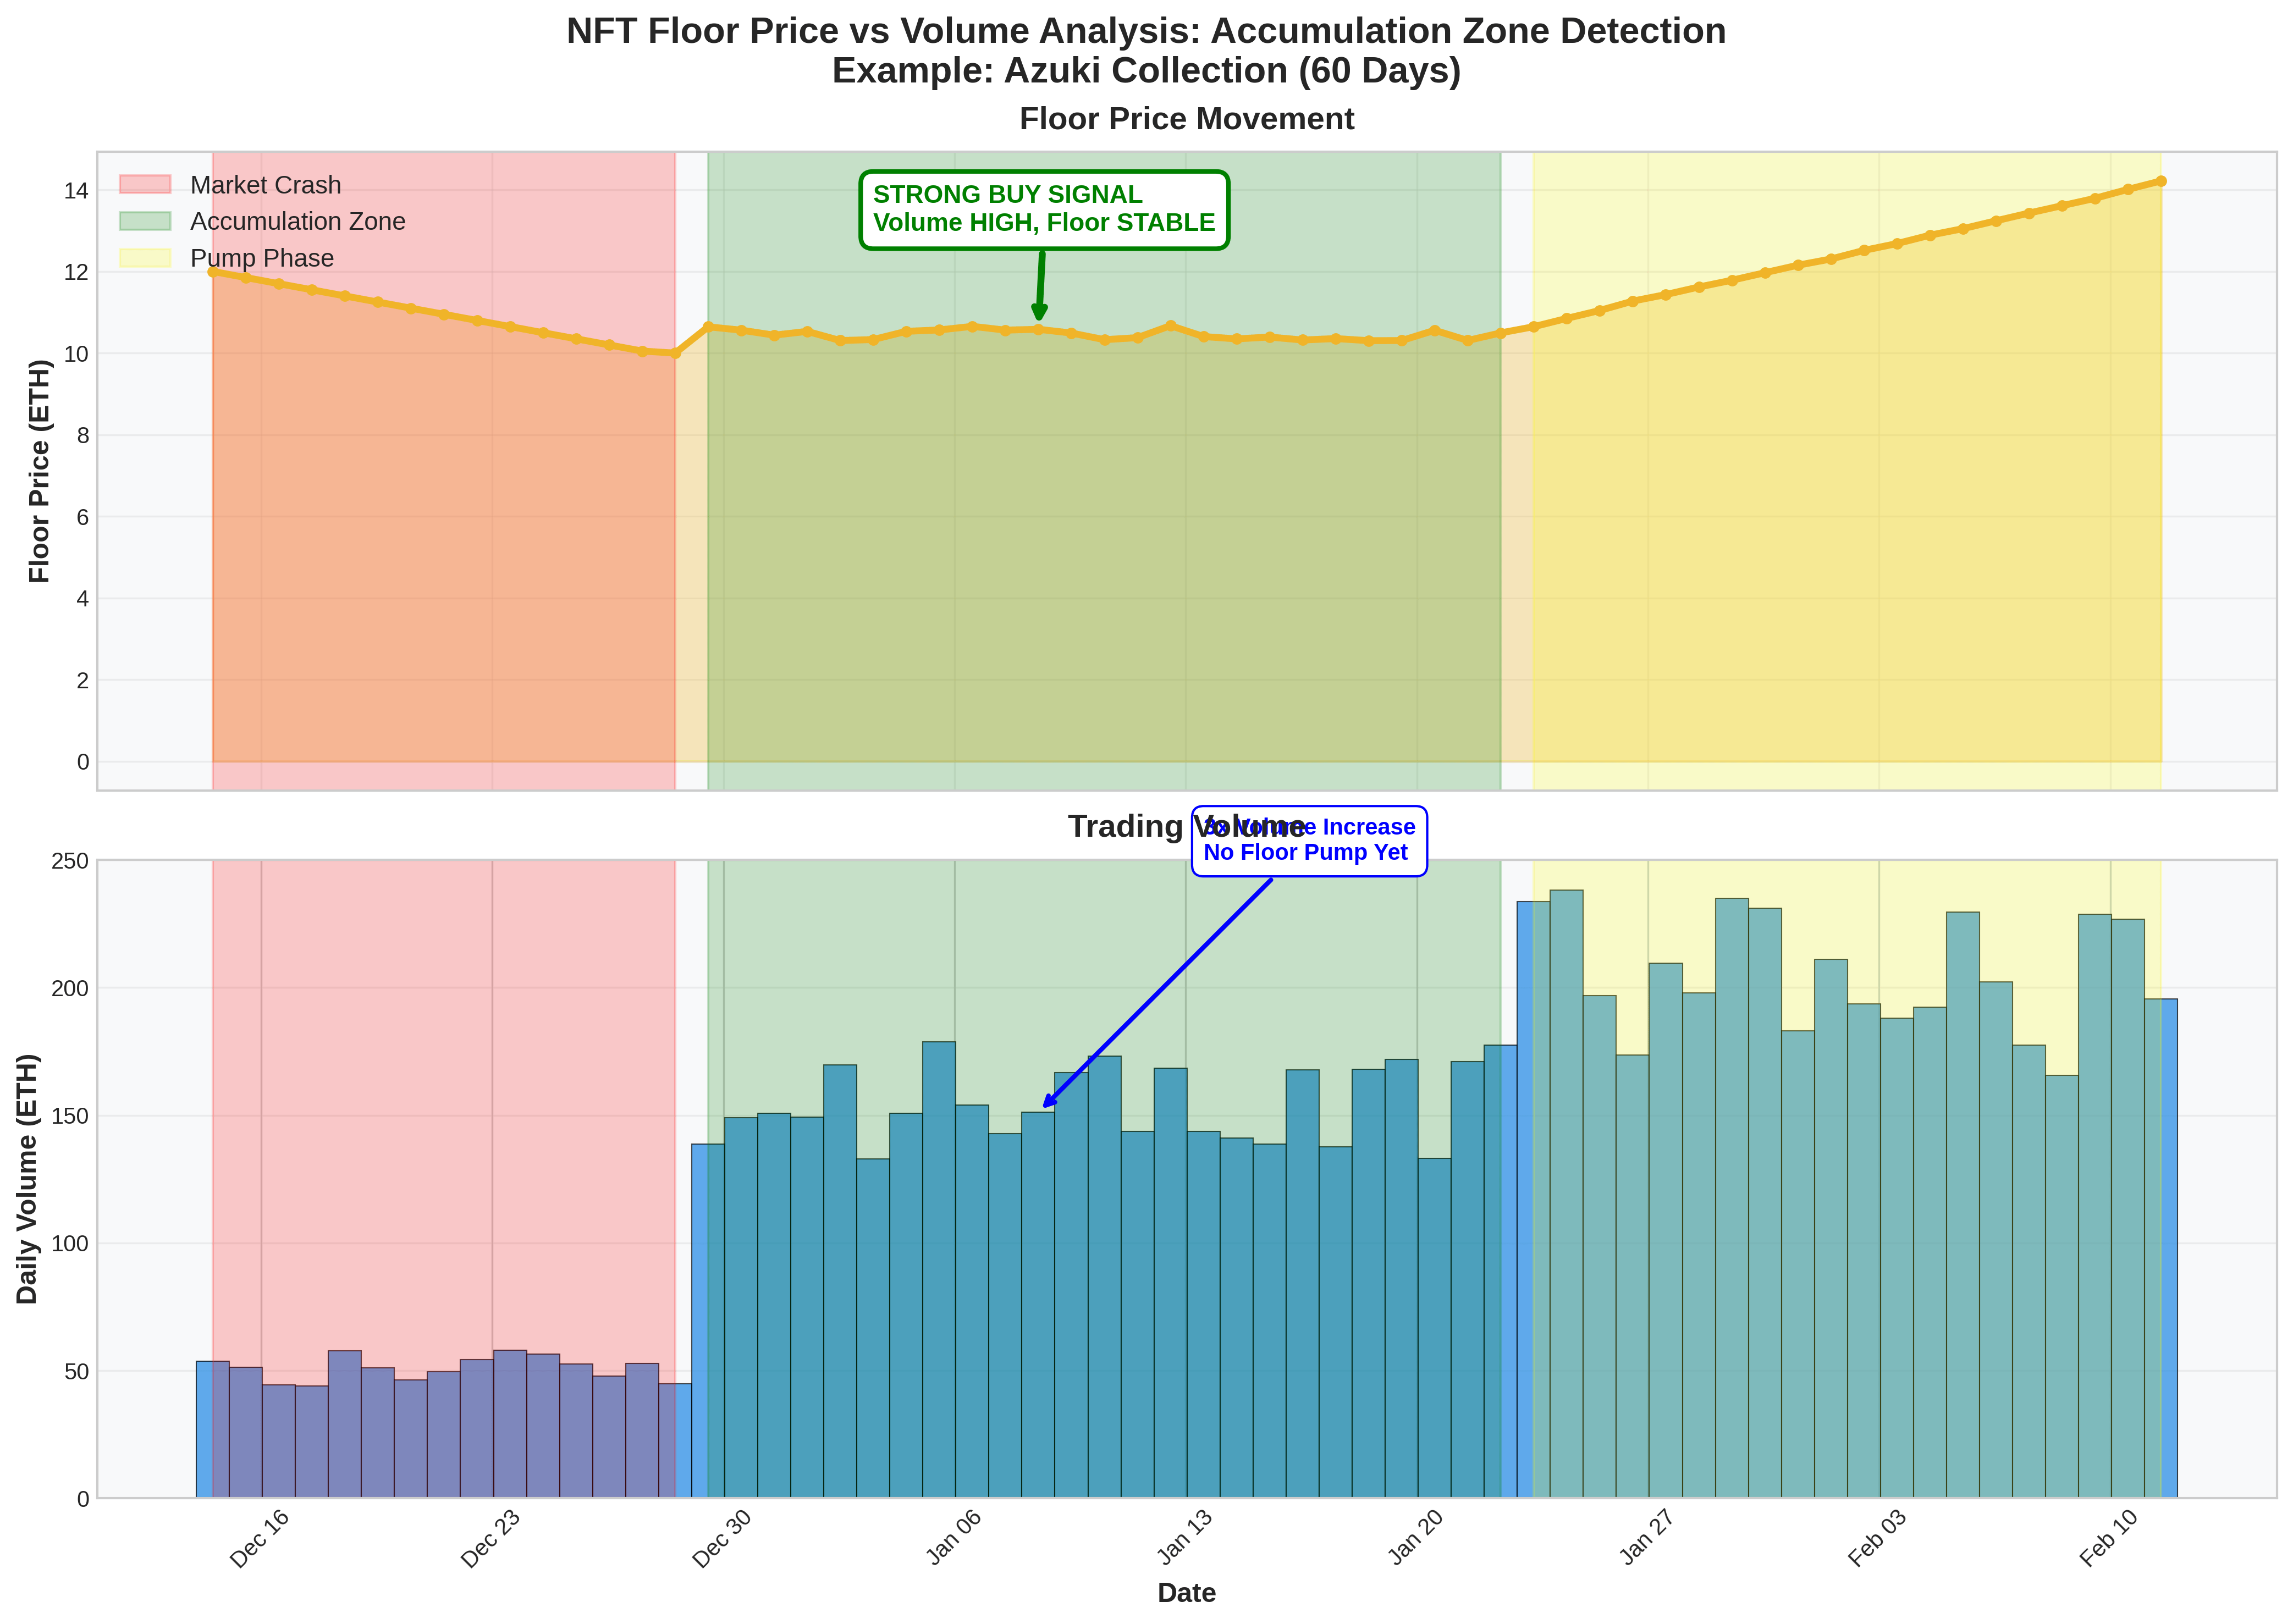
Indicator 2: High Volume but Flat Floor Price
If trading volume suddenly increases 3x–5x, but the floor price stays almost the same, this is a very important sign.
This usually means:
Big buyers (whales) are buying quietly
Accumulation is happening
A pump may come later
⚠️ If volume and price pump together instantly, that is often FOMO and does not last long.
The best setups are:
Volume increases first
Price moves 2–3 weeks later
Wash Trading Detection Patterns
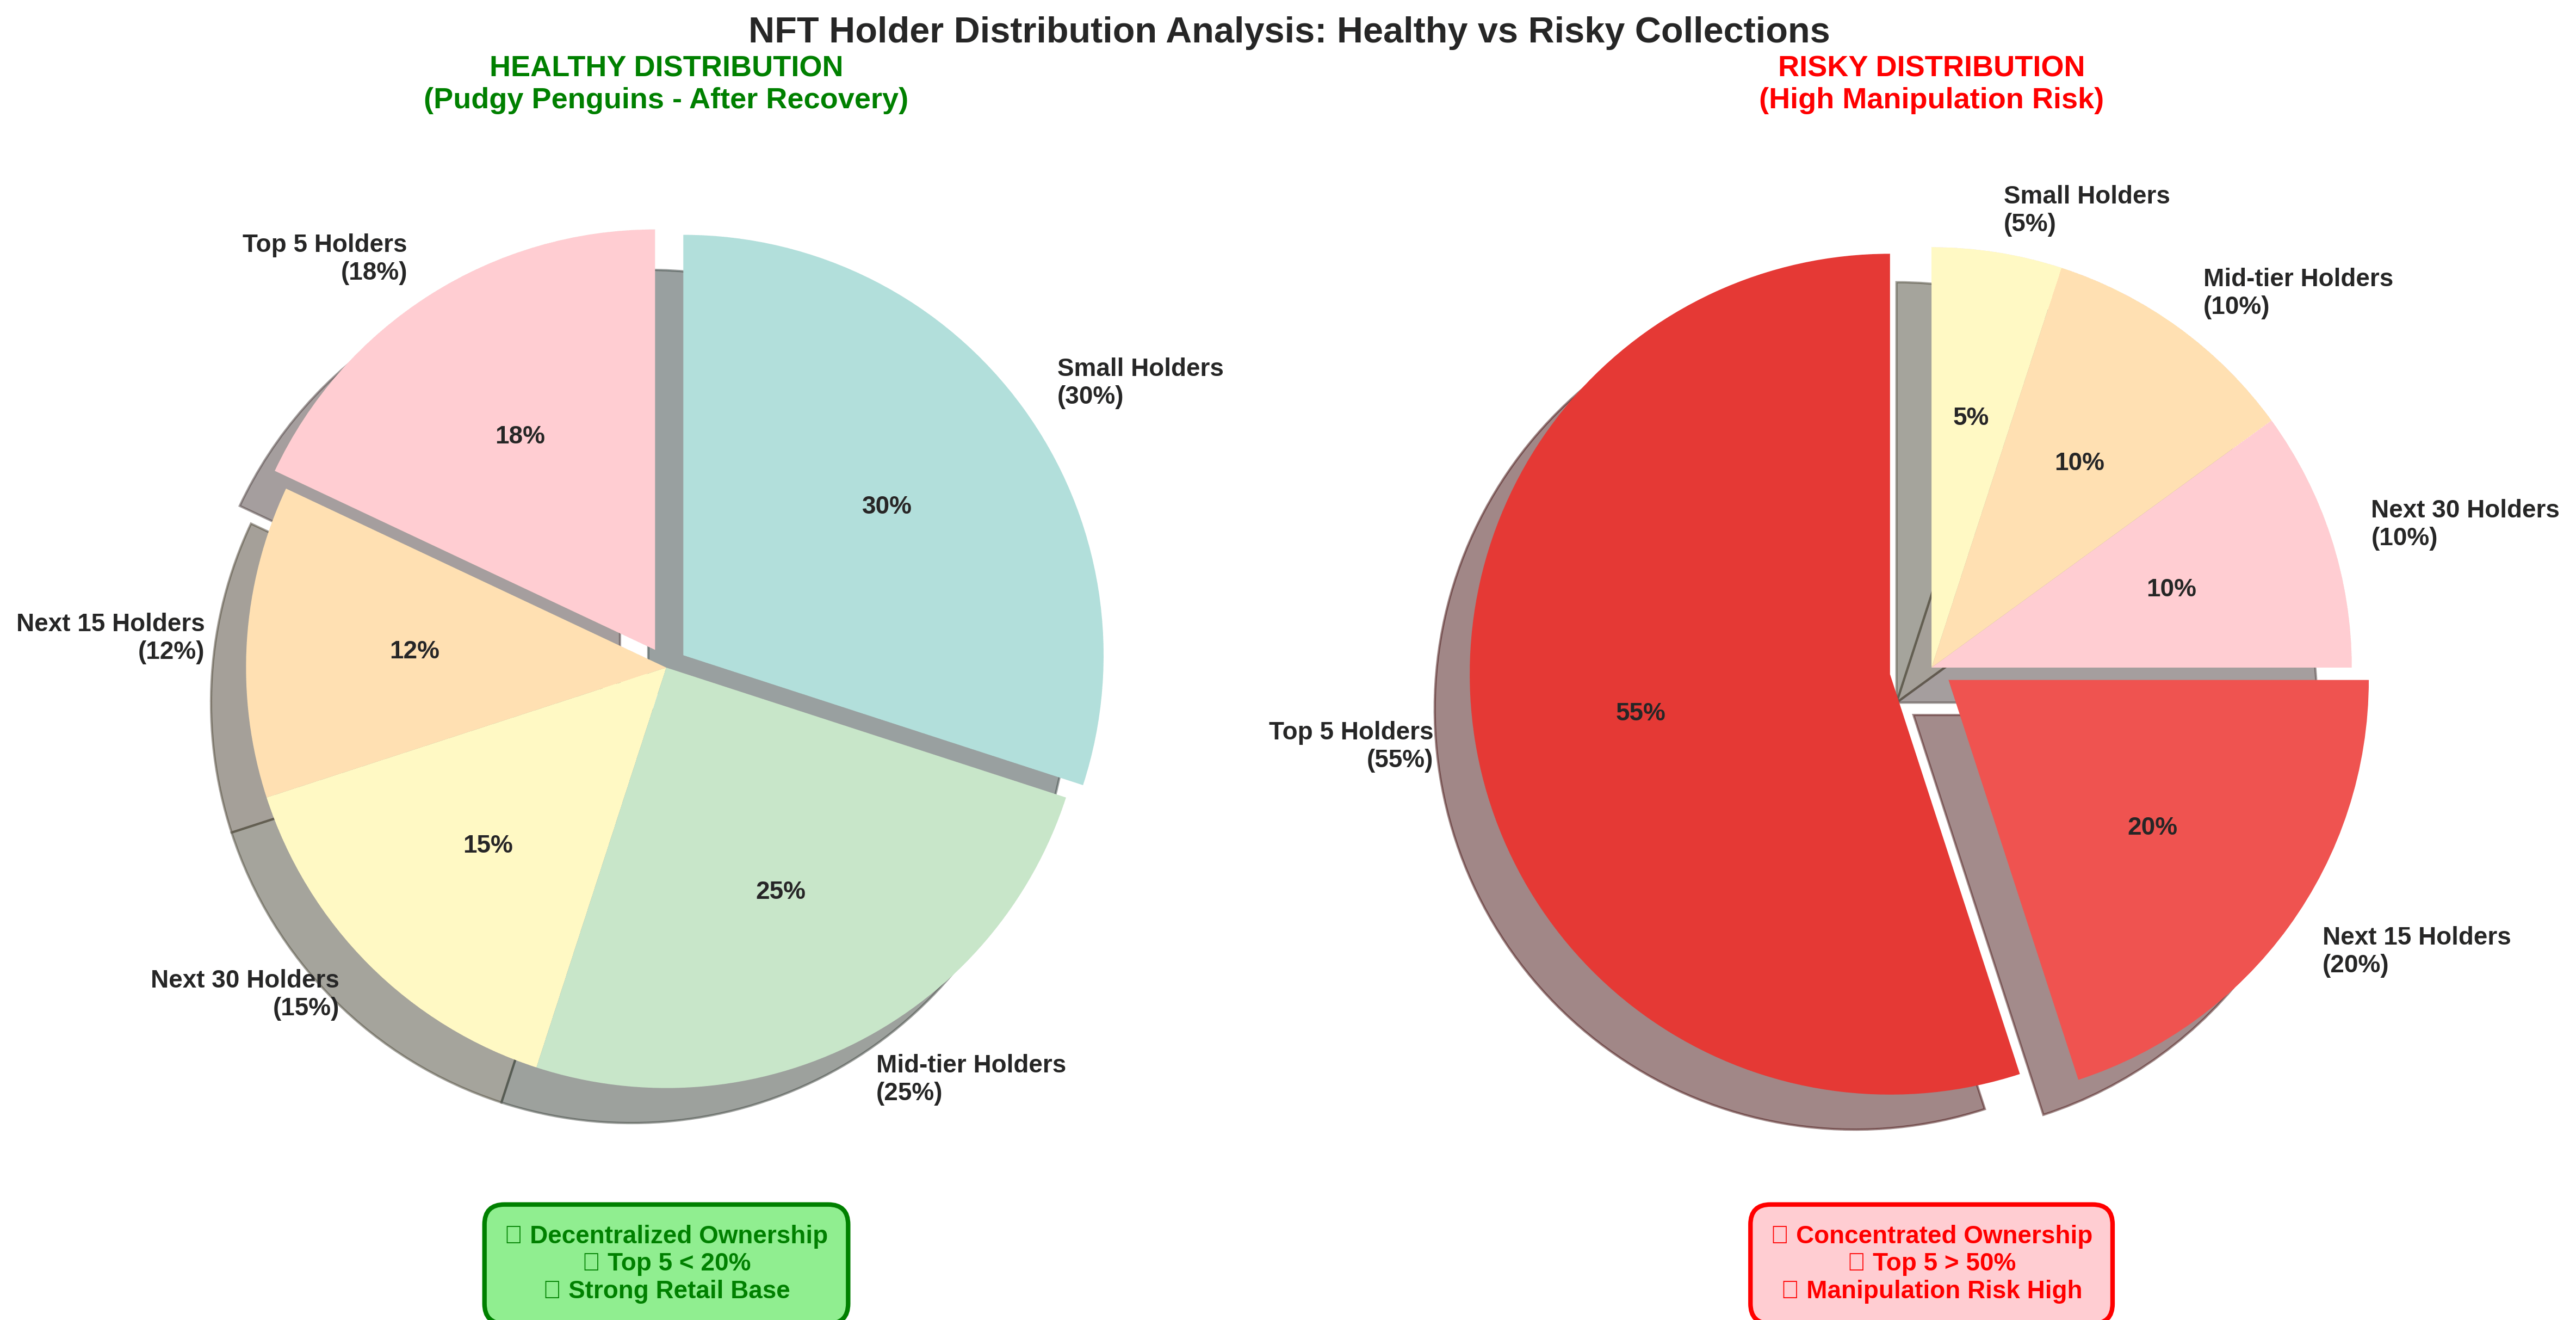
Indicator 3: Healthy Holder Distribution
Check how much supply the top 10 holders control.
Healthy: Top 10 holders own 20–30%
Risky: Top 10 holders own 50% or more
High concentration means price manipulation risk.
Example:
Pudgy Penguins recovered strongly when whale ownership reduced and more regular users started holding NFTs. This decentralization was a bullish1 sign.
Holder Distribution - Healthy vs Unhealthy
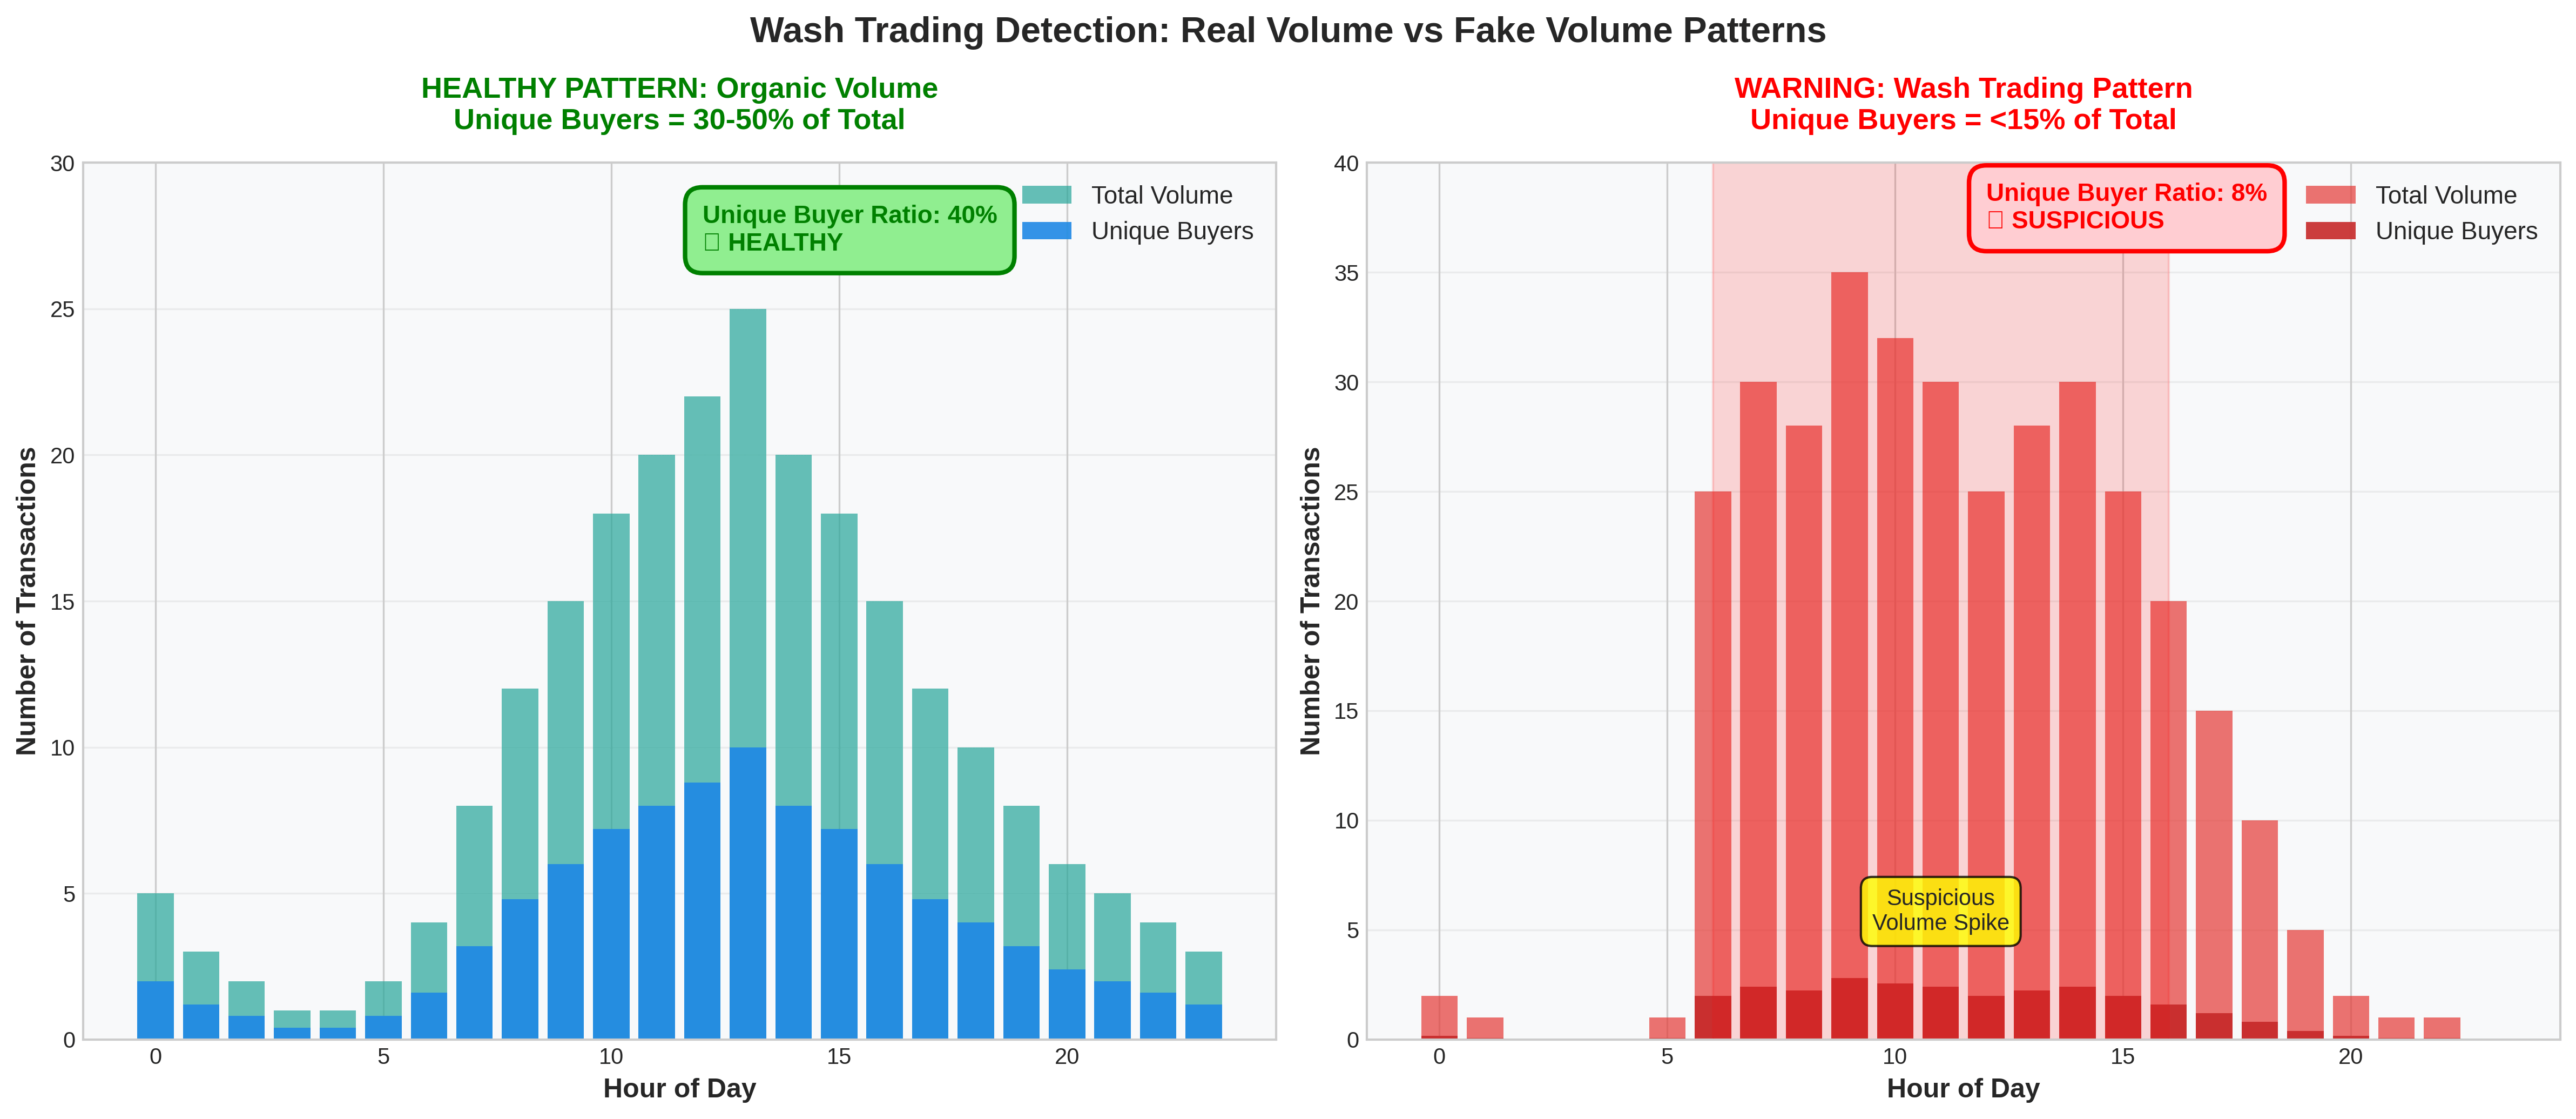
Indicator 4: Unique Buyers Matter More Than Volume
Volume alone can be fake.
100 ETH volume with only 5 buyers = likely wash trading
100 ETH volume with 40–50+ buyers = real demand
Use tools like NFTGo or Nansen to check unique buyers. Free versions are enough for basic analysis.
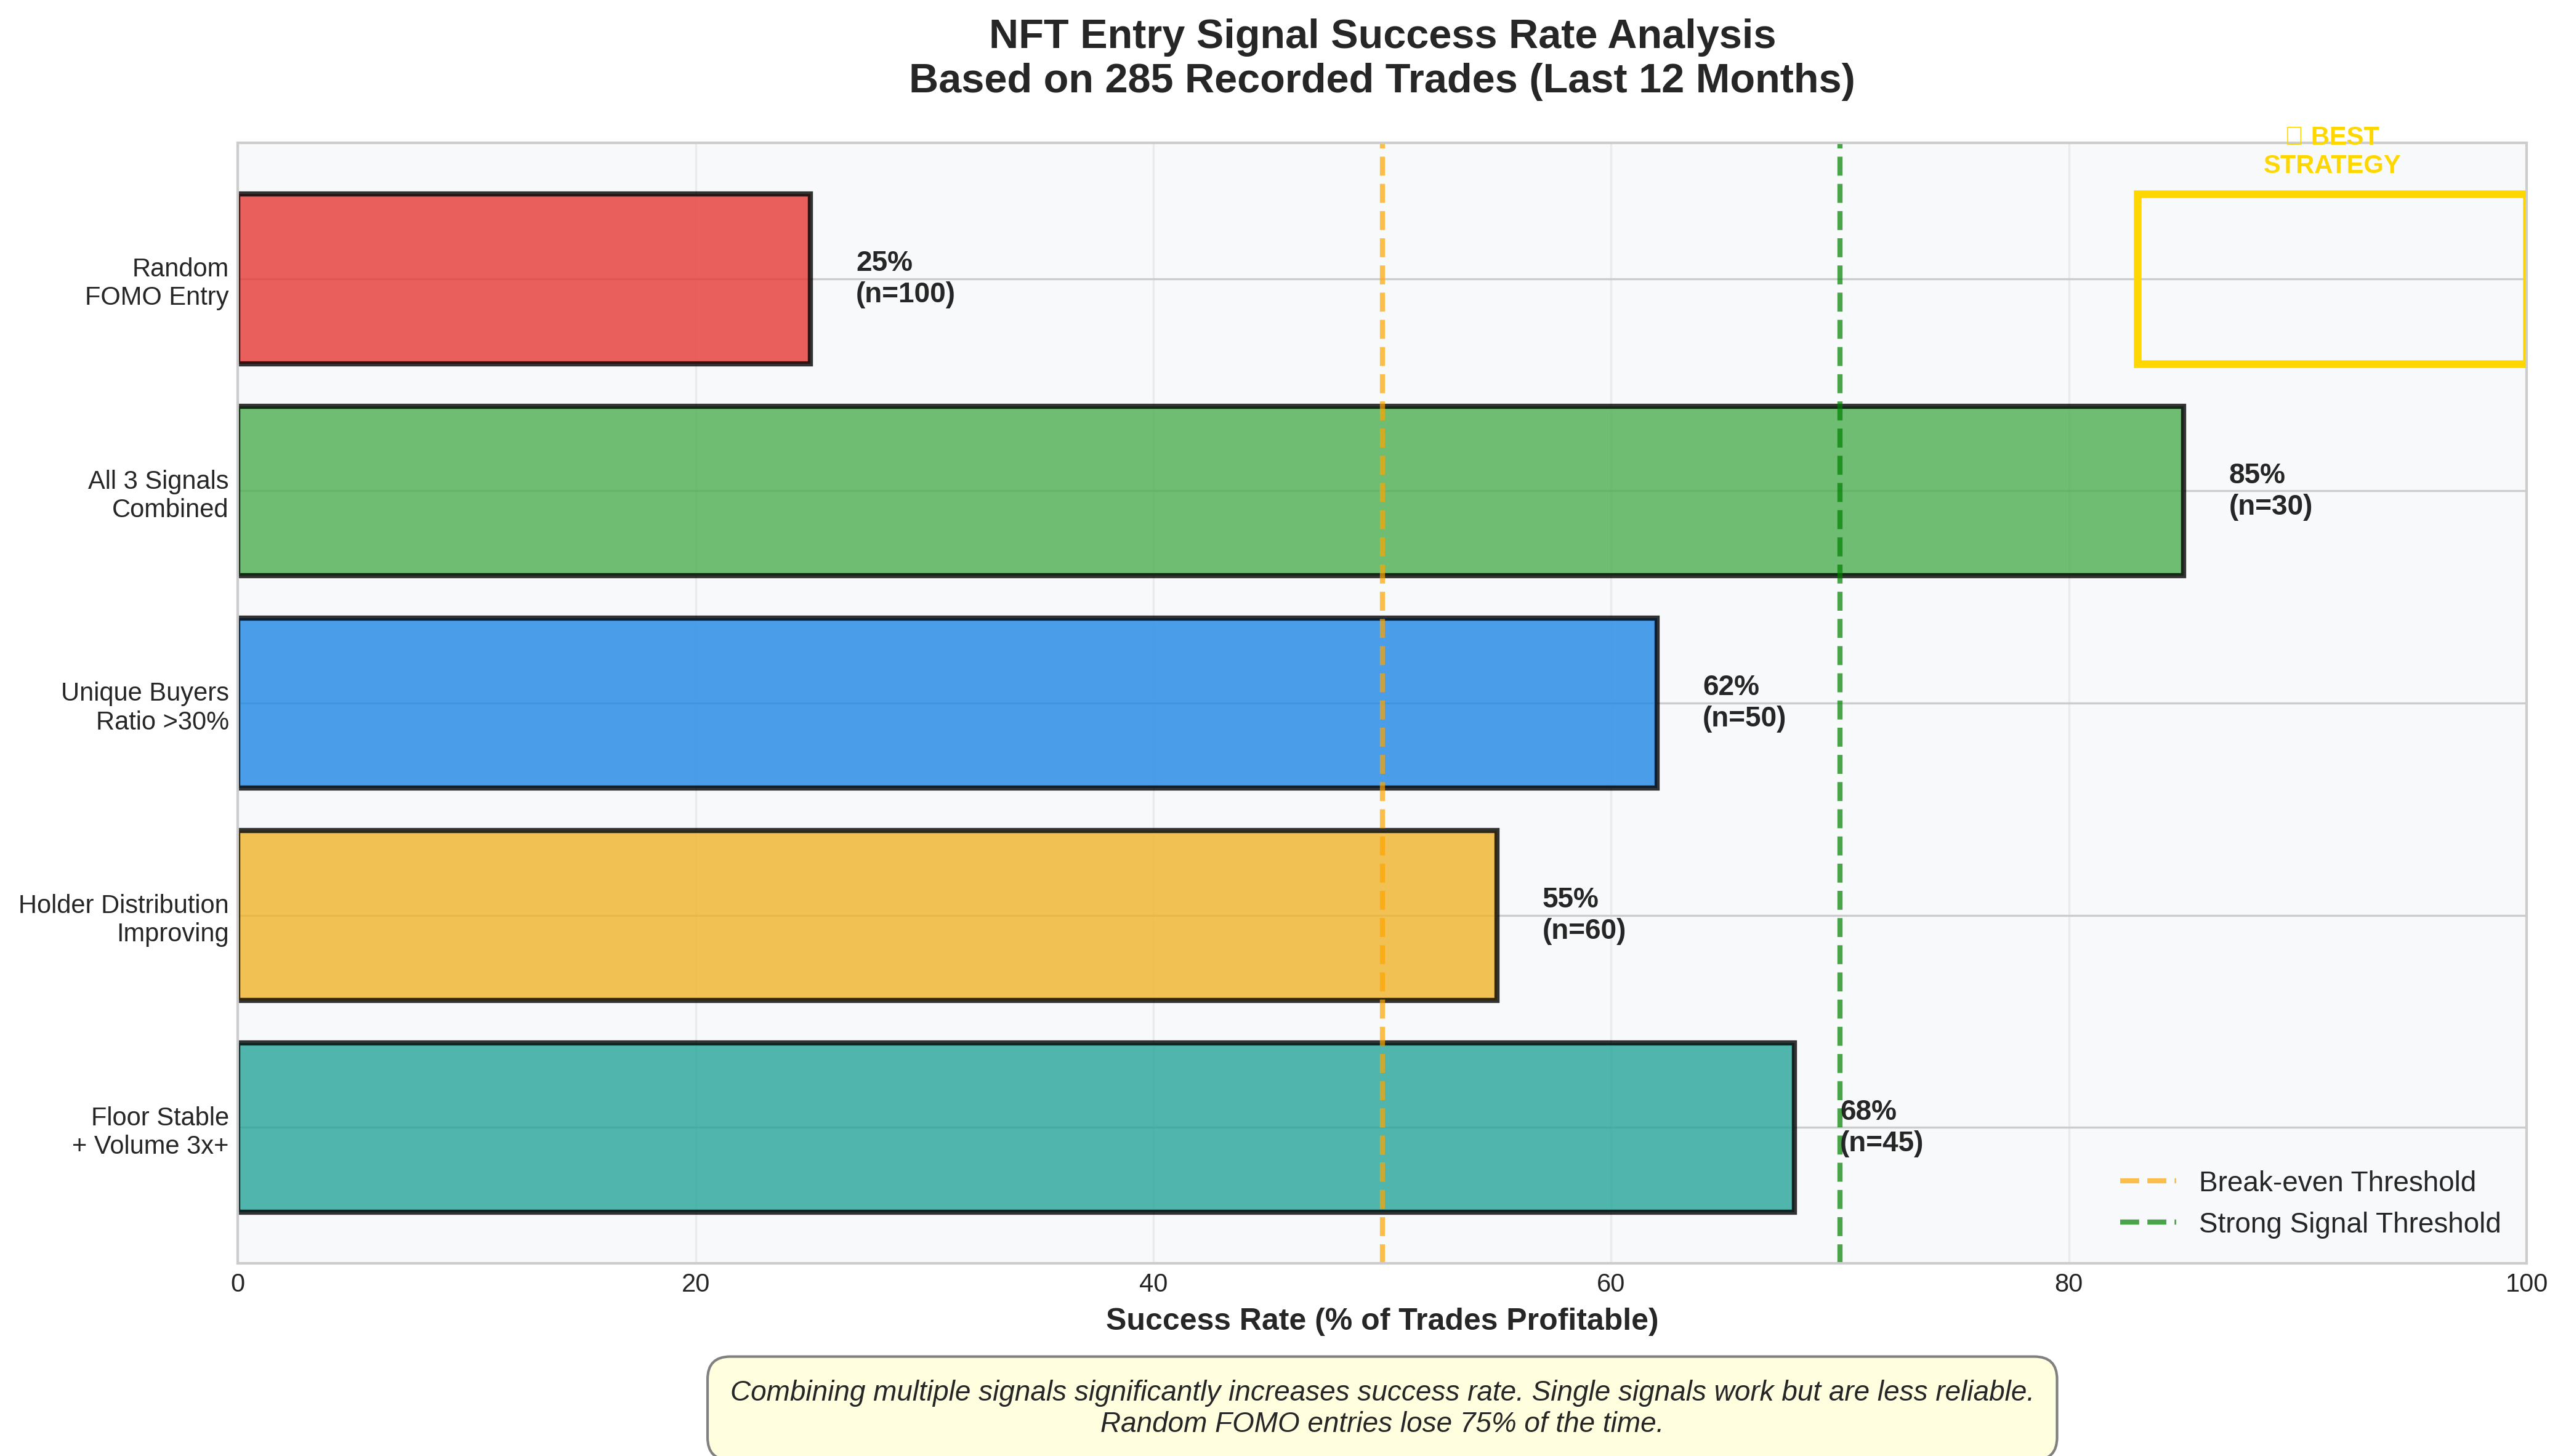
Entry Signal Success Rate Analysis
Case Study: Pudgy Penguins Recovery
December 2025
Floor price: 3 ETH
Daily volume: ~20 ETH (very low)
Early January
Volume jumps to 80–100 ETH daily
Floor stays around 3–3.2 ETH
Mid January
More unique buyers
Better holder distribution
Late January
Toy announcement
Floor moves to 5 ETH
February
Floor reaches 8 ETH
That’s 2.6x from the accumulation zone
If you bought around 3.2 ETH and sold at 8 ETH, you made 150% profit — just by following data, not hype.
Simple Action Plan You Can Follow This Week
Choose 5–10 well-known NFT collections you understand
Track floor price and volume daily (takes 5 minutes)
Check holder distribution once a week
If volume increases 3x+ and floor stays stable, add it to your watchlist
NFT flipping is not luck. It is about pattern recognition.
When most people buy due to hype, smart traders are already in profit.
Important Risk Reminder
NFTs are very illiquid
Never invest more than 10–20% of your crypto portfolio
Always plan your exit before buying
Indicators help, but nothing is guaranteed
#USTechFundFlows #WhaleDeRiskETH #BitcoinGoogleSearchesSurge #USNFPBlowout #BinanceSquare
