An #Xrp🔥🔥 monthly chart shared by analyst Arthur maps nine years of price structure from March 2017 to early 2026. The chart shows XRP trading near $1.40 while resting on a major support zone between $0.85 and $0.95.
Arthur states that the channel drawn on the chart is speculative and not a price prediction. He says the structure only visualizes long-term movement within an ascending channel.
The chart uses monthly candles, where each candle represents one full month of price action. It spans nearly nine years of data, covering support, resistance, and volume behavior. Arthur notes that long-term charts remove short-term noise and reveal structural trends.
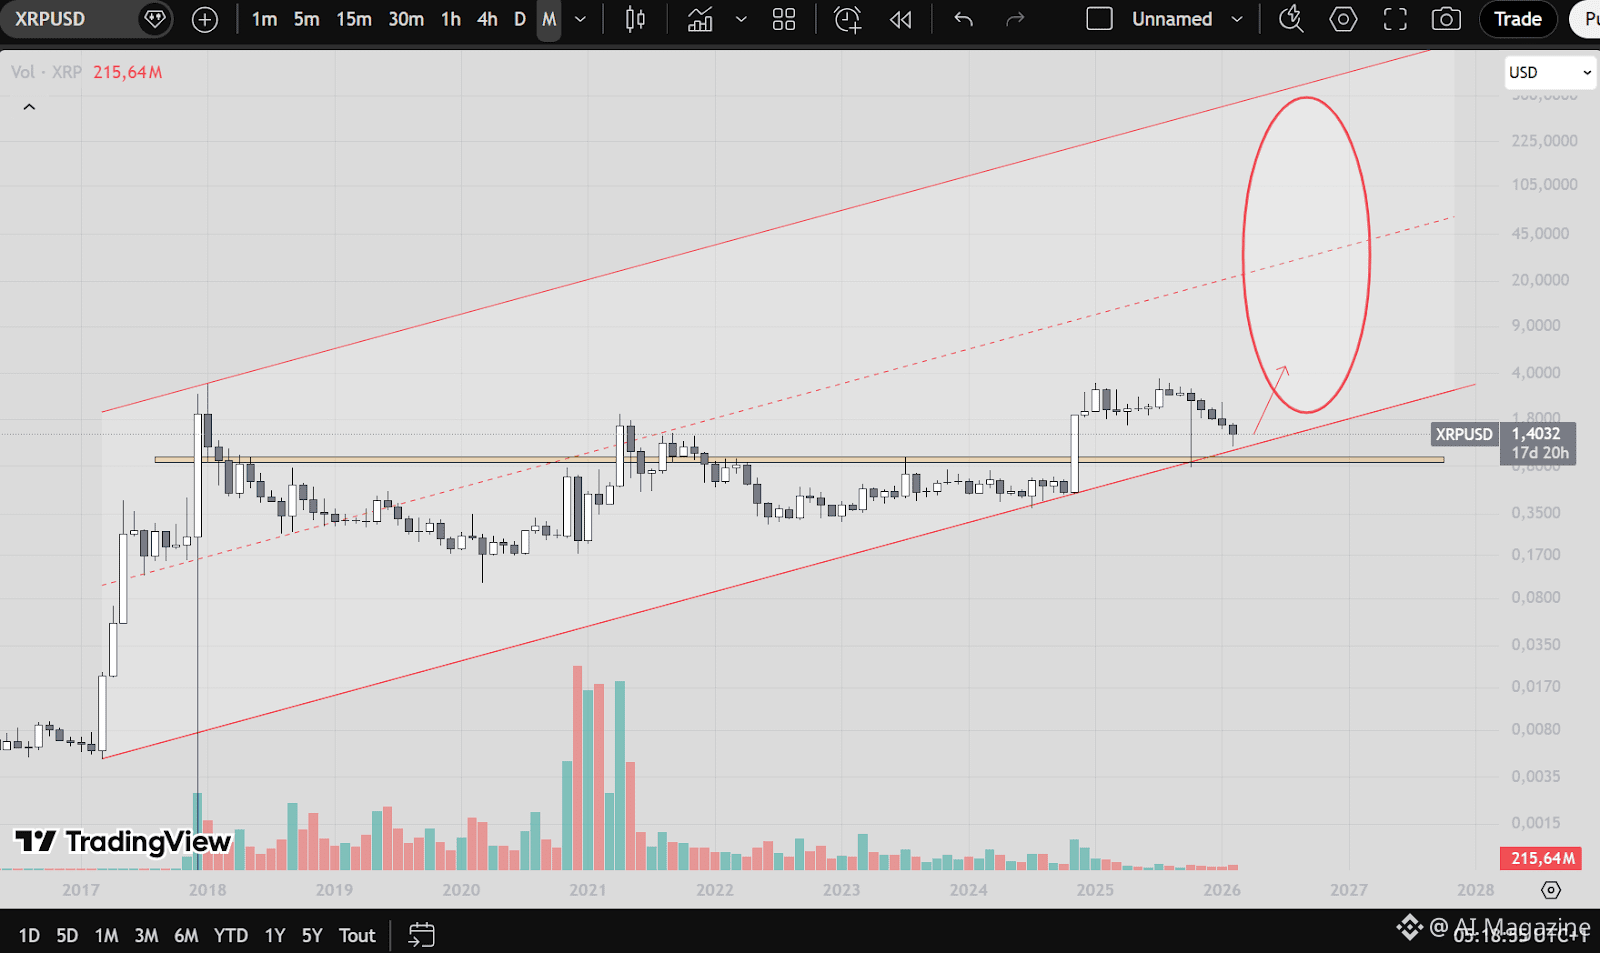
Volume data on the chart shows 215.64 million XRP in recent activity. The highest historical volume spike occurred between November 2020 and April 2021. According to Arthur, the 2024 rally had four times the volume of the 2021 peak.
Nine Years of Structure on the Monthly Chart
The visual structure outlines a long-term ascending channel. A lower red trendline connects major lows since 2017. An upper red boundary projects long-term resistance into 2027 and 2028.
A dotted red mid-channel line runs through the structure, indicating a possible median trajectory. XRP currently trades close to the lower boundary of the channel. The price label on the chart shows #XRPUSD at $1.4032.
A horizontal beige zone marks the long-term support range between $0.85 and $0.95. Arthur describes this area as the strongest historical support on the monthly timeframe. The support aligns with the bottom trendline of the ascending channel.
Arthur states that the chart does not predict extreme targets such as $700. He clarifies that the channel represents speculation to visualize structure, not guaranteed outcomes. He frames the analysis as an objective structural read.
Volume Behavior and Institutional Flow
The volume bars at the bottom of the chart reveal a clear pattern. The largest spike in XRP’s history appeared from late 2020 through early 2021. After that period, volume declined sharply.
#Arthur reports that the 2024 rally generated far less participation than the 2021 surge. He states that the real institutional capital that reshapes markets has not returned yet. Instead, he describes 2024 activity as driven by whales and some funds.
The author connects technical structures with their associated macroeconomic contexts. Arthur identifies regulatory clarity, RLUSD launch and growth, institutional adoption of ripple technology, tokenization expansion, and infrastructure development as essential elements for success in early 2026.
Arthur states that technical analysis operates based on current market conditions. He states that the broader backdrop for XRP stands stronger in early 2026 than in prior cycles.
Macro Context and the 2026 Outlook
Arthur notes that Ripple continued development after its lawsuit ended. He states that major banks now integrate stablecoin infrastructure. He also references tokenization and the growth of on-chain finance.
The chart displays a red oval projection into 2026, suggesting potential expansion within the channel. Arthur does not assign a target price to that zone. Instead, he frames it as a possible structural continuation.
He states that the bottom of the monthly channel may represent the area where smart money returns. He says the real volume surge has not yet arrived. What happens if a large institutional flow reenters at this structural support?
Arthur concludes that the setup reflects macro alignment and long-term volume behavior. He describes the current level as the point at which major macro moves often begin in historical cycles.
The Bigger Picture
The XRP monthly chart shows a nine-year ascending channel with price resting near the $0.85–$0.95 support zone. Volume remains far below the 2021 peak, while macro factors such as the Ripple RLUSD launch and institutional integration shape the 2026 outlook. Market participants now watch for renewed institutional volume at this structural level.