Many people are asking, where exactly does #比特币 drop to be considered a bottom? Is it time to buy with eyes closed, or should we wait a bit longer?
In Benjamin's latest video, he reveals the secrets of bottom fishing through historical data and quantitative indicators.
Here are the key points I have organized for you:
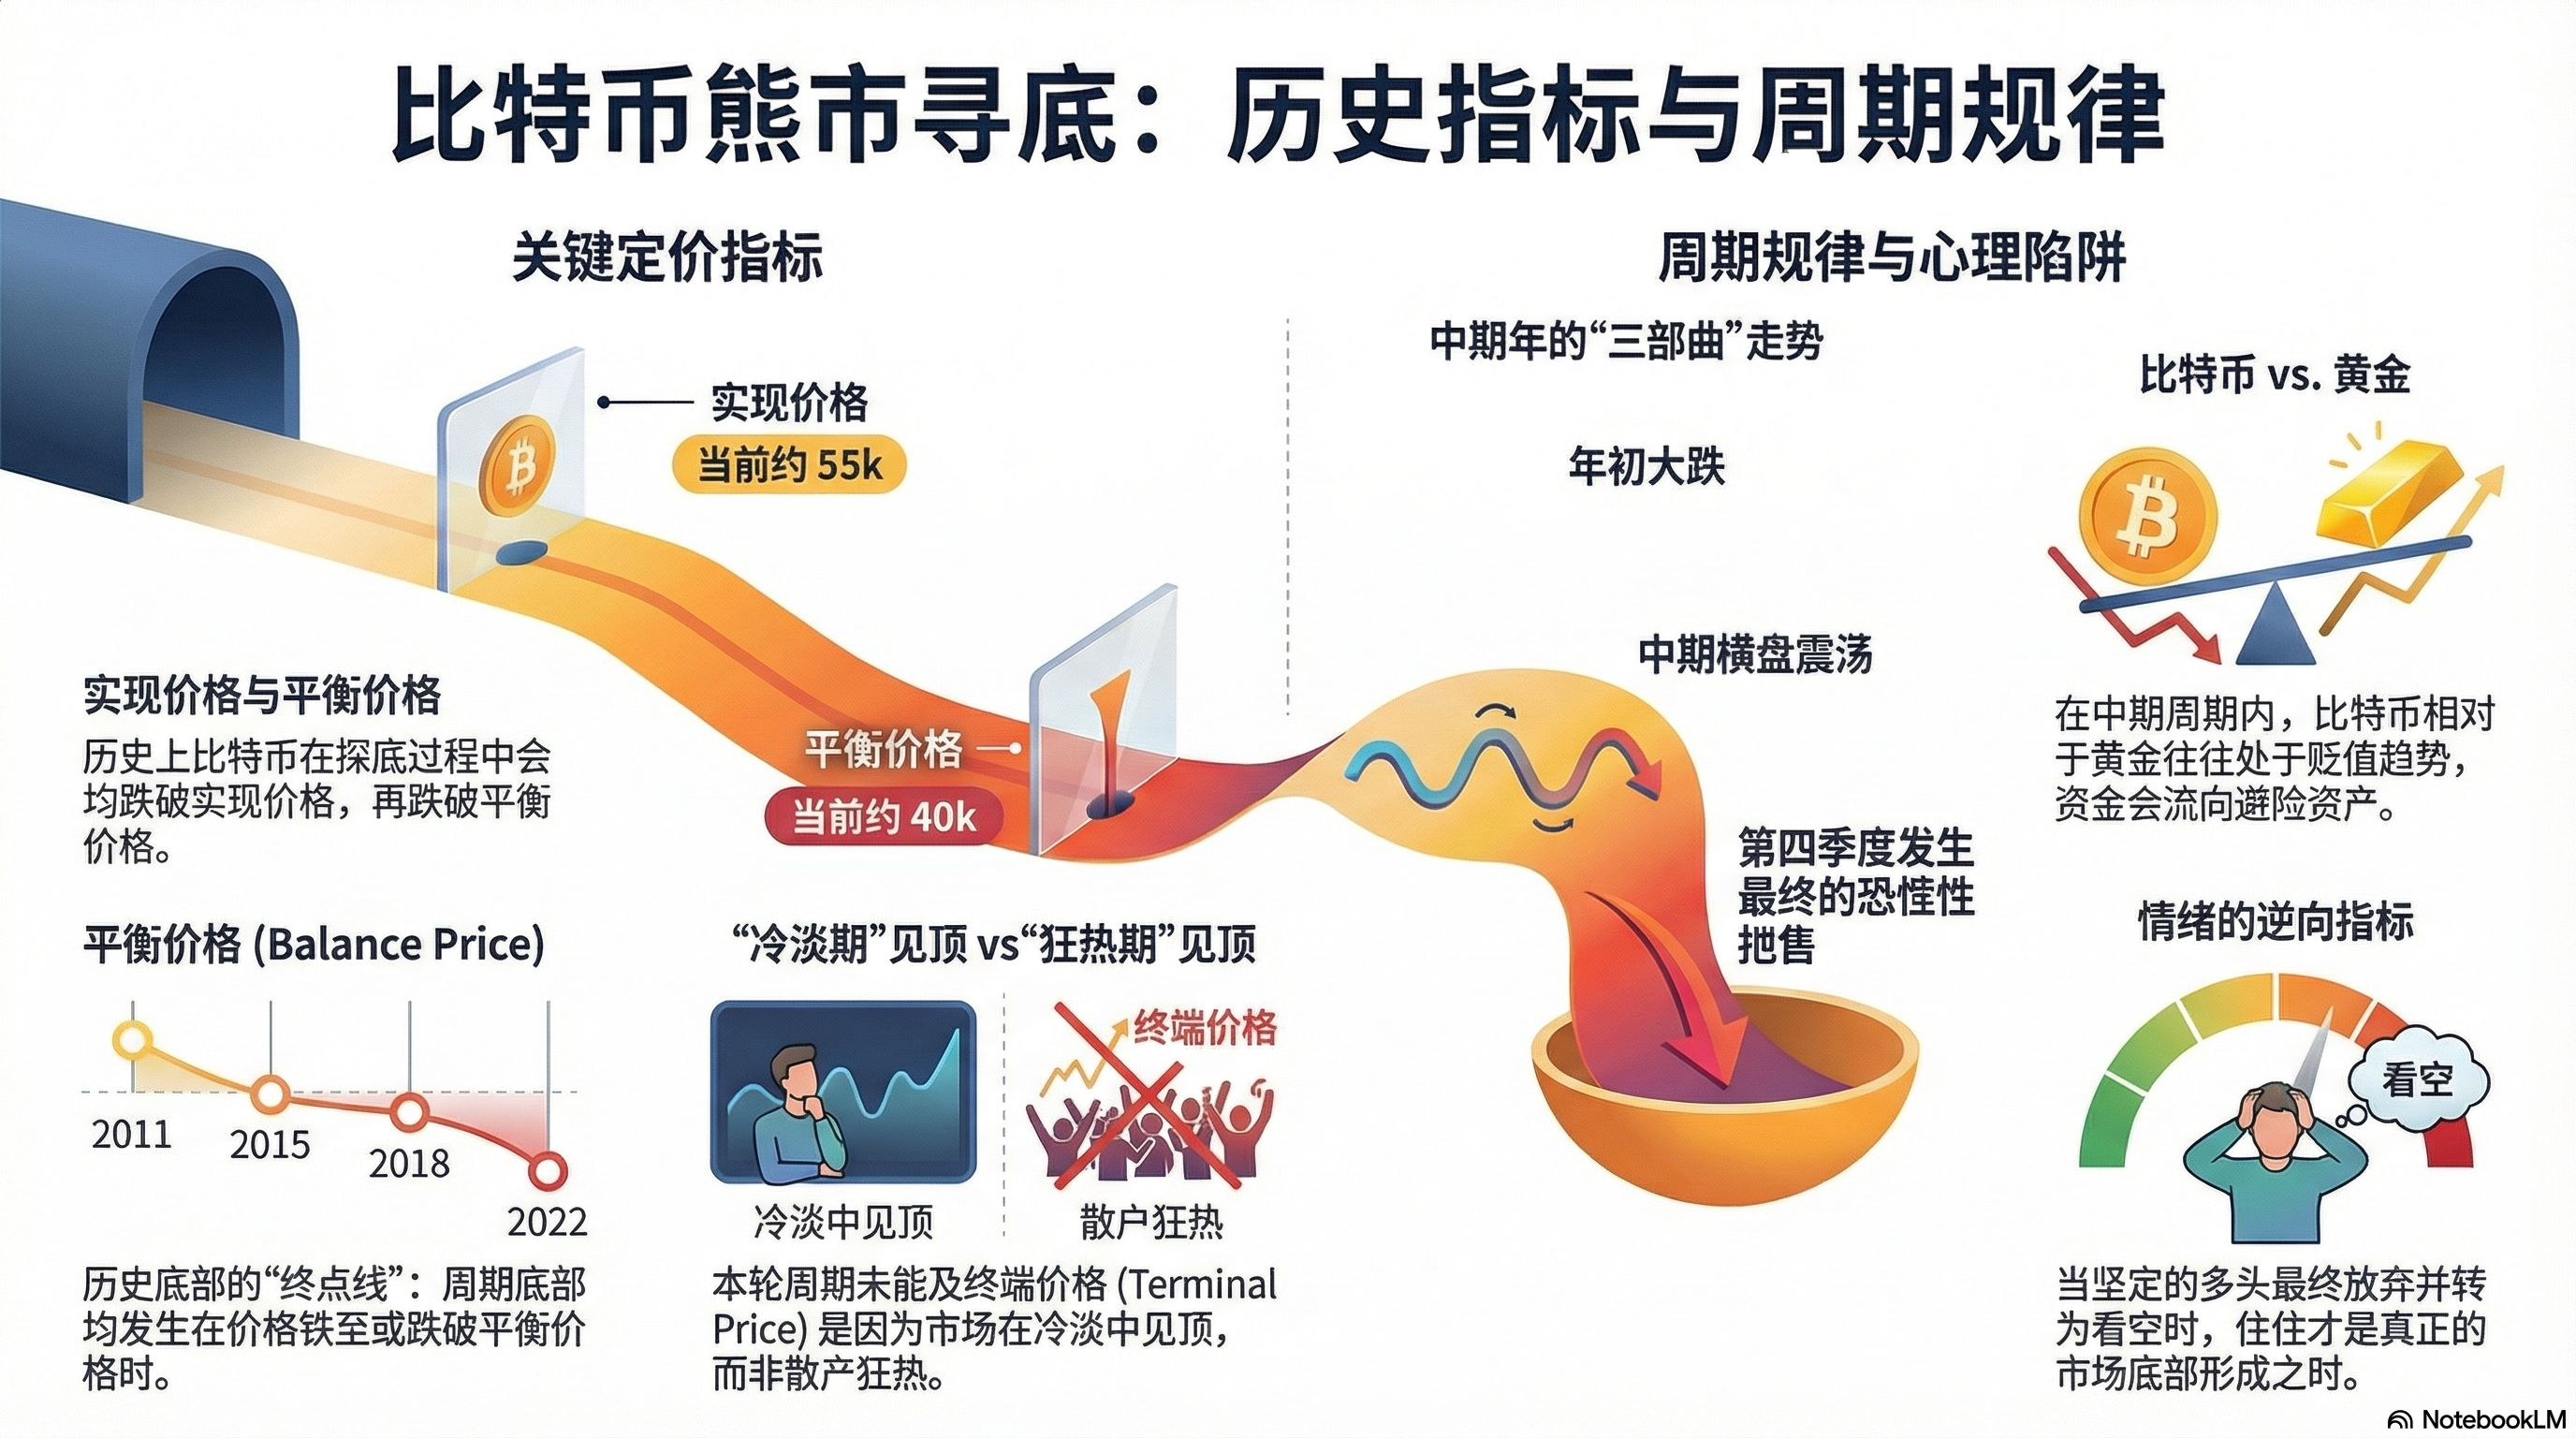
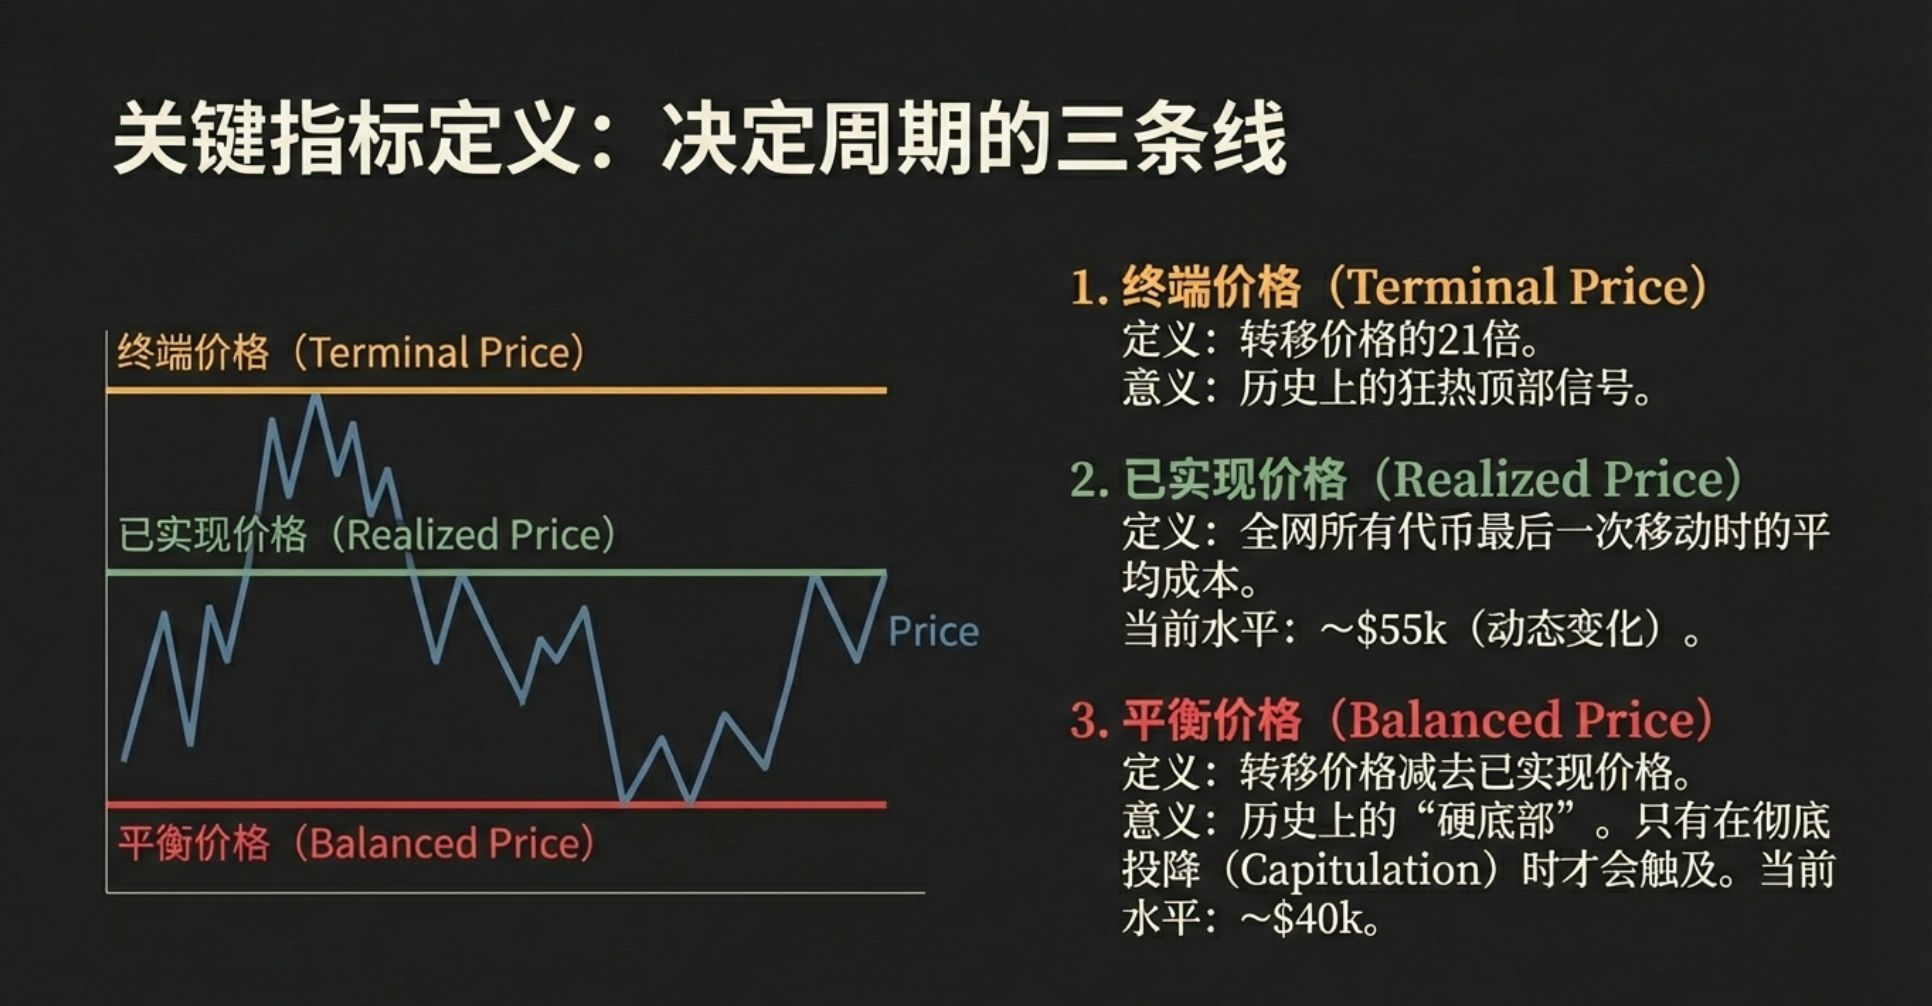
First, keep a close eye on these two "death lines" in price. Historical data shows that $BTC usually breaks two key levels in every bear market (especially in mid-term years like this one): the realized price and the balance price.
The first line of defense (realized price): currently around $55,000.
The final floor price (equilibrium price): currently around $40,000.
Remember, every major bottom in history is usually formed only after the price breaks below the equilibrium price. Although these two numbers will fluctuate over time, they are the most important metrics for you to judge 'whether to bottom fish'.
Second: Pay attention to the bear market cycle declines
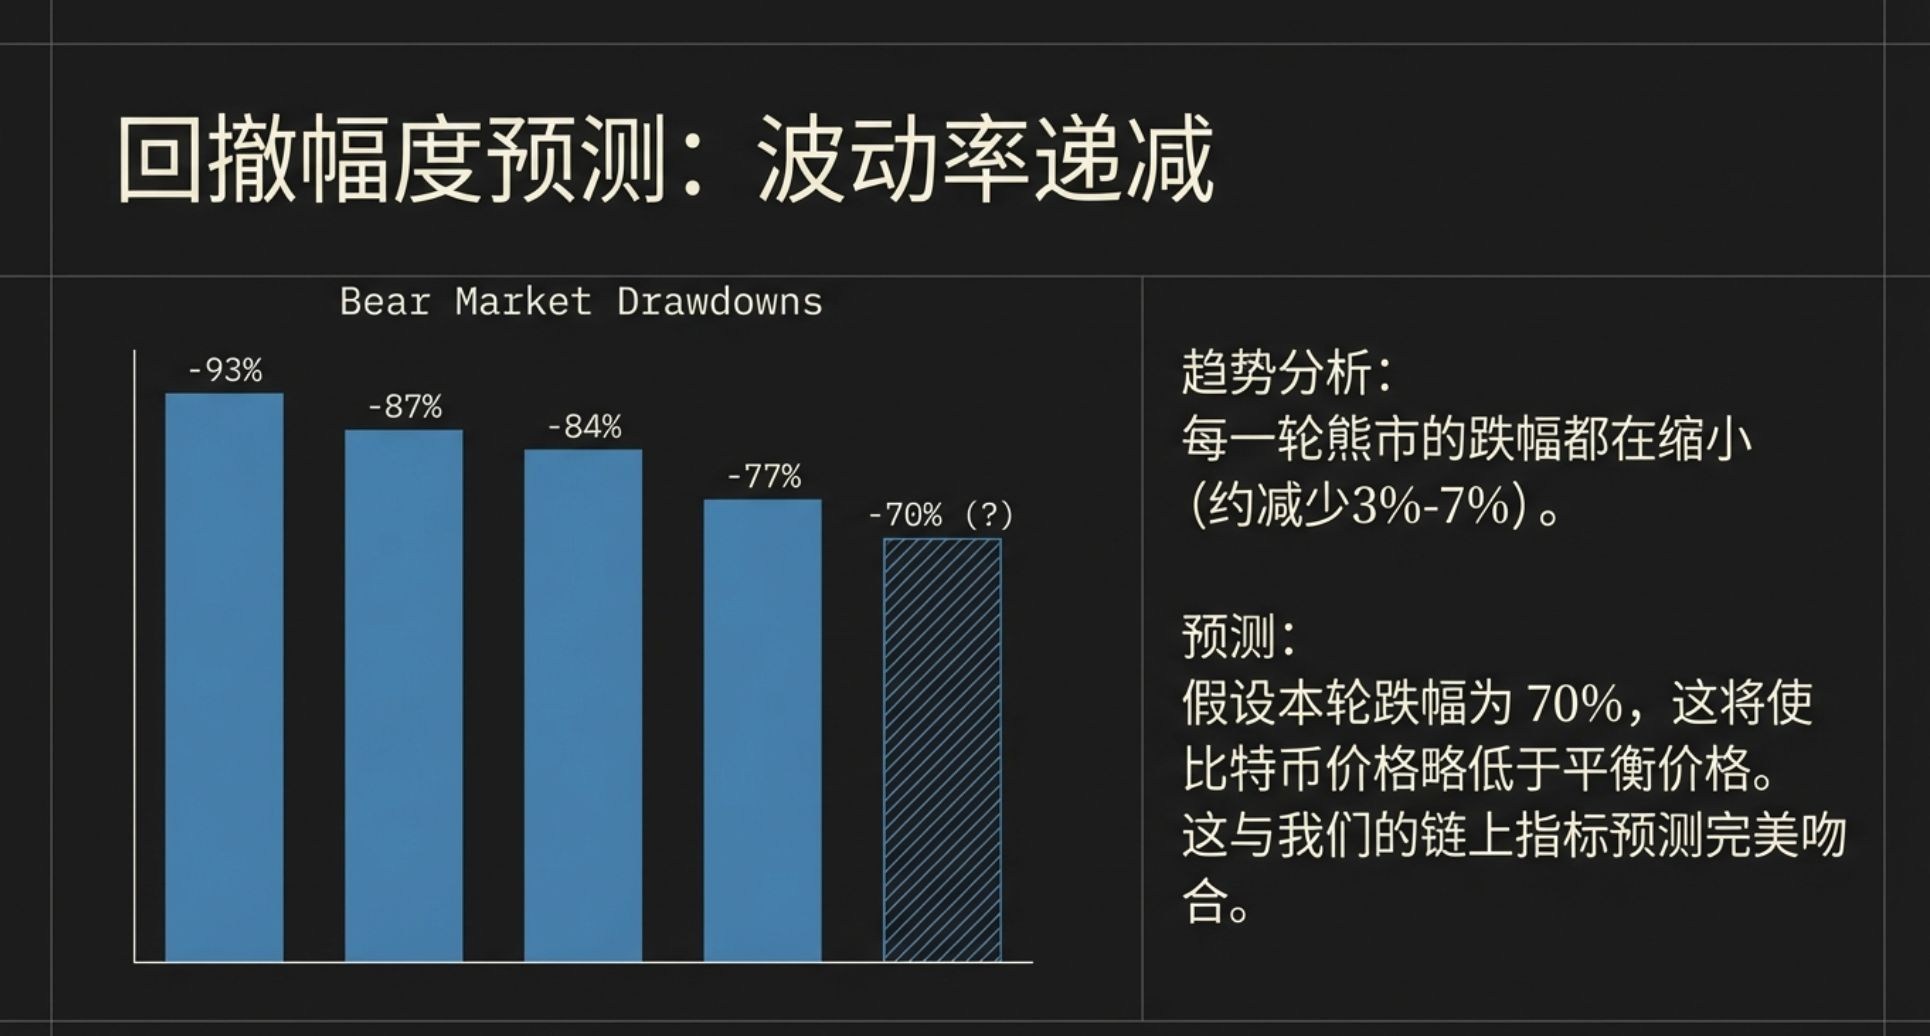
From 2013 to the present, BTC has experienced four cycles of bull and bear markets, with the maximum declines being 93% → 87% → 84% → 77%, showing a decrease of about 7% trend. If this round is calculated with a 70% retracement from the 25-year high of $126,000, the bear market low would be around $37,800. Compared to the current price, there may still be 50% downside potential.
Third, do not be deceived by the 'cold' market
This peak is different from the past. In the past, it was a nationwide frenzy, with retail investors charging ahead (Euphoria), while this time it is because everyone has 'lost interest' (Apathy), which is reminiscent of the situation in 2019. Because there was no crazy chasing of highs, Bitcoin has not been able to reach the theoretical peak, but this does not mean it does not need to break below the bottom indicators to complete the bottoming process. The cycle may be late, but the rules will not be absent.
Fourth, be careful of the 'rebound trap' in a bear market
What torments people the most in a bear market is not the slow decline, but the sharp rebounds. Benjamin reminds us:
In a bear market, the number of days the price rises may even exceed the number of days it falls, which can make bears question their lives and lead bulls to have the illusion that 'the bull market has returned'. This kind of rebound attracts many people to add positions at high levels, while the real 'surrender selling' often occurs in the fourth quarter. Historical patterns show that Bitcoin usually crashes at the beginning of the year, fluctuates in the middle of the year, and ultimately completes a final drop at the end of the year.
Fifth, pay attention to these two key time windows
If you are looking for a bottom-fishing opportunity, pay close attention to May and October.
If by these two time points, Bitcoin has broken below the aforementioned two key prices, and market sentiment reaches extreme despair, then the long-term bull market bottom can be considered truly formed. Until then, any hasty full investment may have to bear significant psychological pressure.
Sixth, take a look at the trend of gold
Currently, Bitcoin is underperforming relative to gold. Historically, in every mid-term year (such as 2014, 2018, 2022), the price of Bitcoin against gold has been declining. It is wise to remain patient until Bitcoin regains strength against gold.
Summary of recommendations
The true bottom often appears when even the most steadfast 'bulls' are completely desperate, removing their bull market filters and turning bearish. Instead of betting on a specific number, it is better to follow the cycle and enter the market when everyone else gives up.