Bitcoin Long-Term Cycle Breakdown 📊
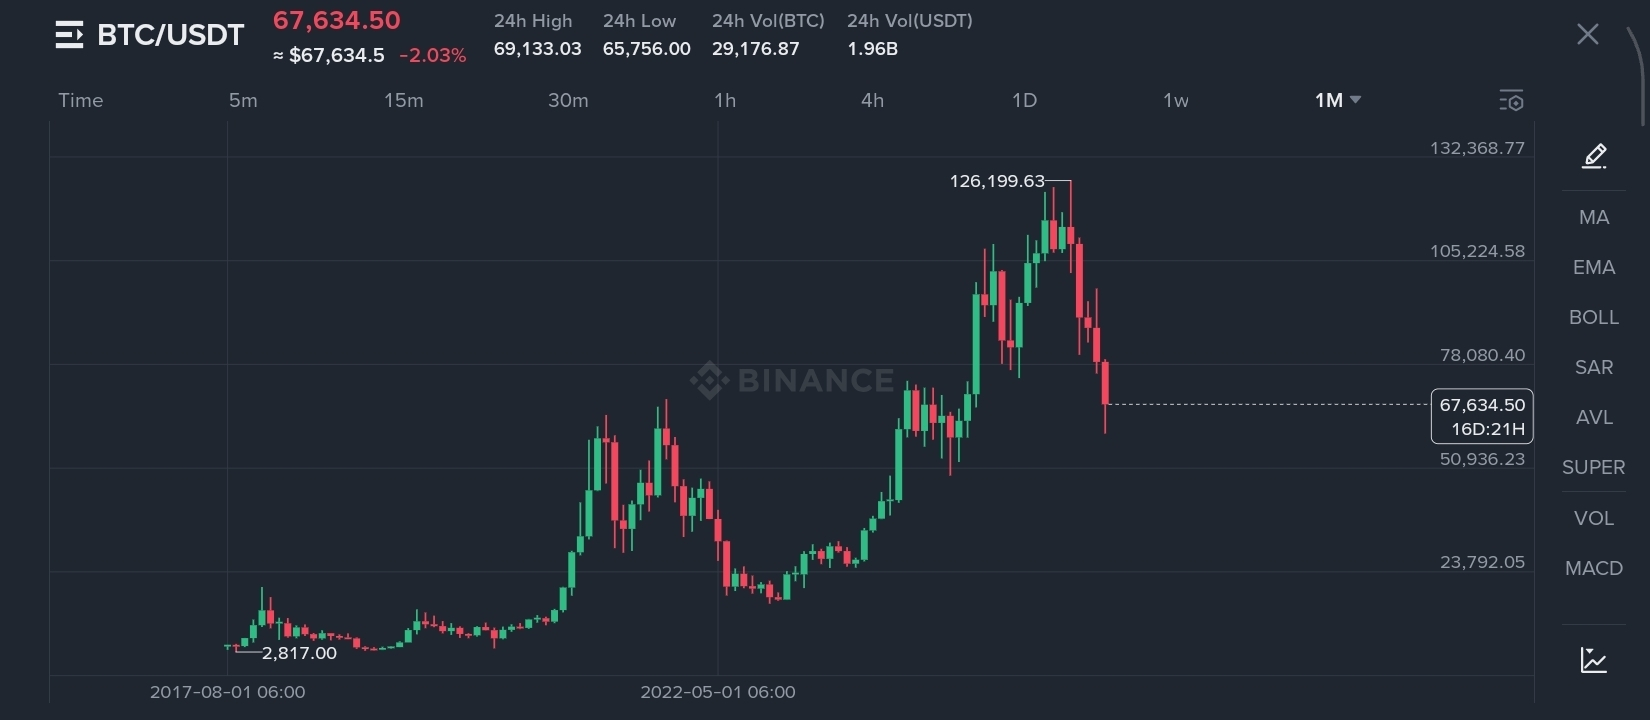
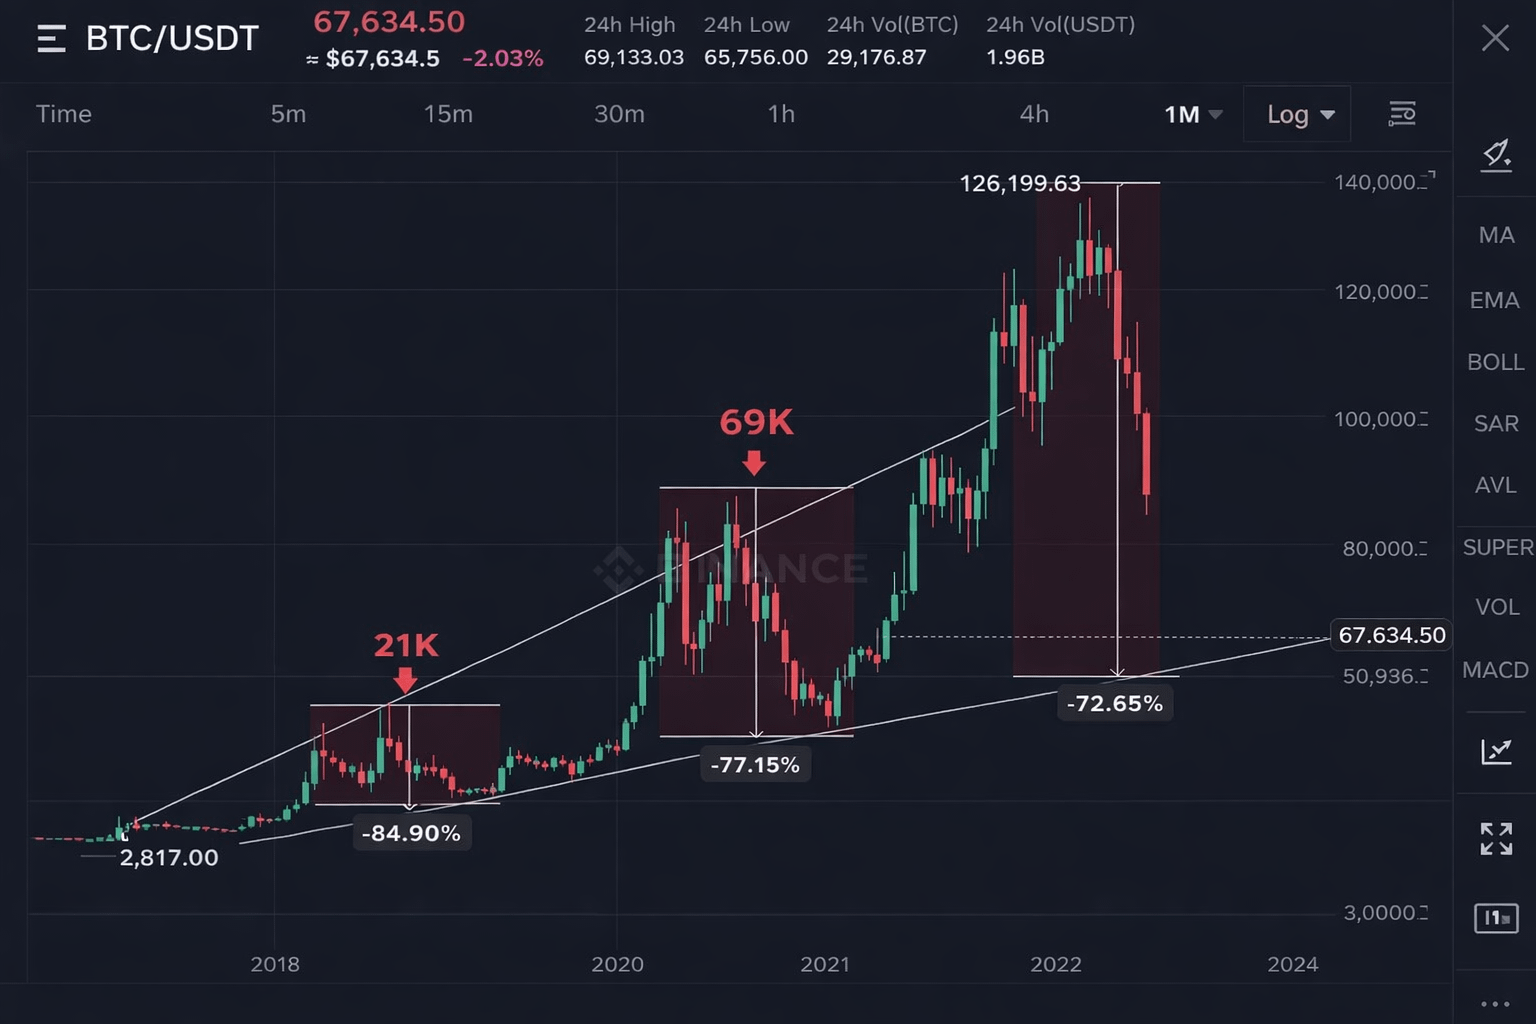
This chart shows Bitcoin $BTC on the monthly timeframe (log scale) — highlighting its long-term price structure.
• 21K → 69K → 126K
Each cycle has produced a new higher high
• After every ATH (All-Time High), Bitcoin experienced a deep correction:
– 2017: −84.9%
– 2021: −77.15%
– 2025: −72.65%
• The white ascending line represents the long-term support trendline — meaning the macro uptrend structure is still intact
• Current price (~67K) sits in a major historical correction zone, similar to previous cycle pullback.
👉 Main Idea:
Historically, Bitcoin makes a massive pump → deep correction → then creates a new higher high.
The current drop aligns closely with previous bull cycle corrections.
History doesn’t repeat exactly — but it often rhymes. 🚀
