

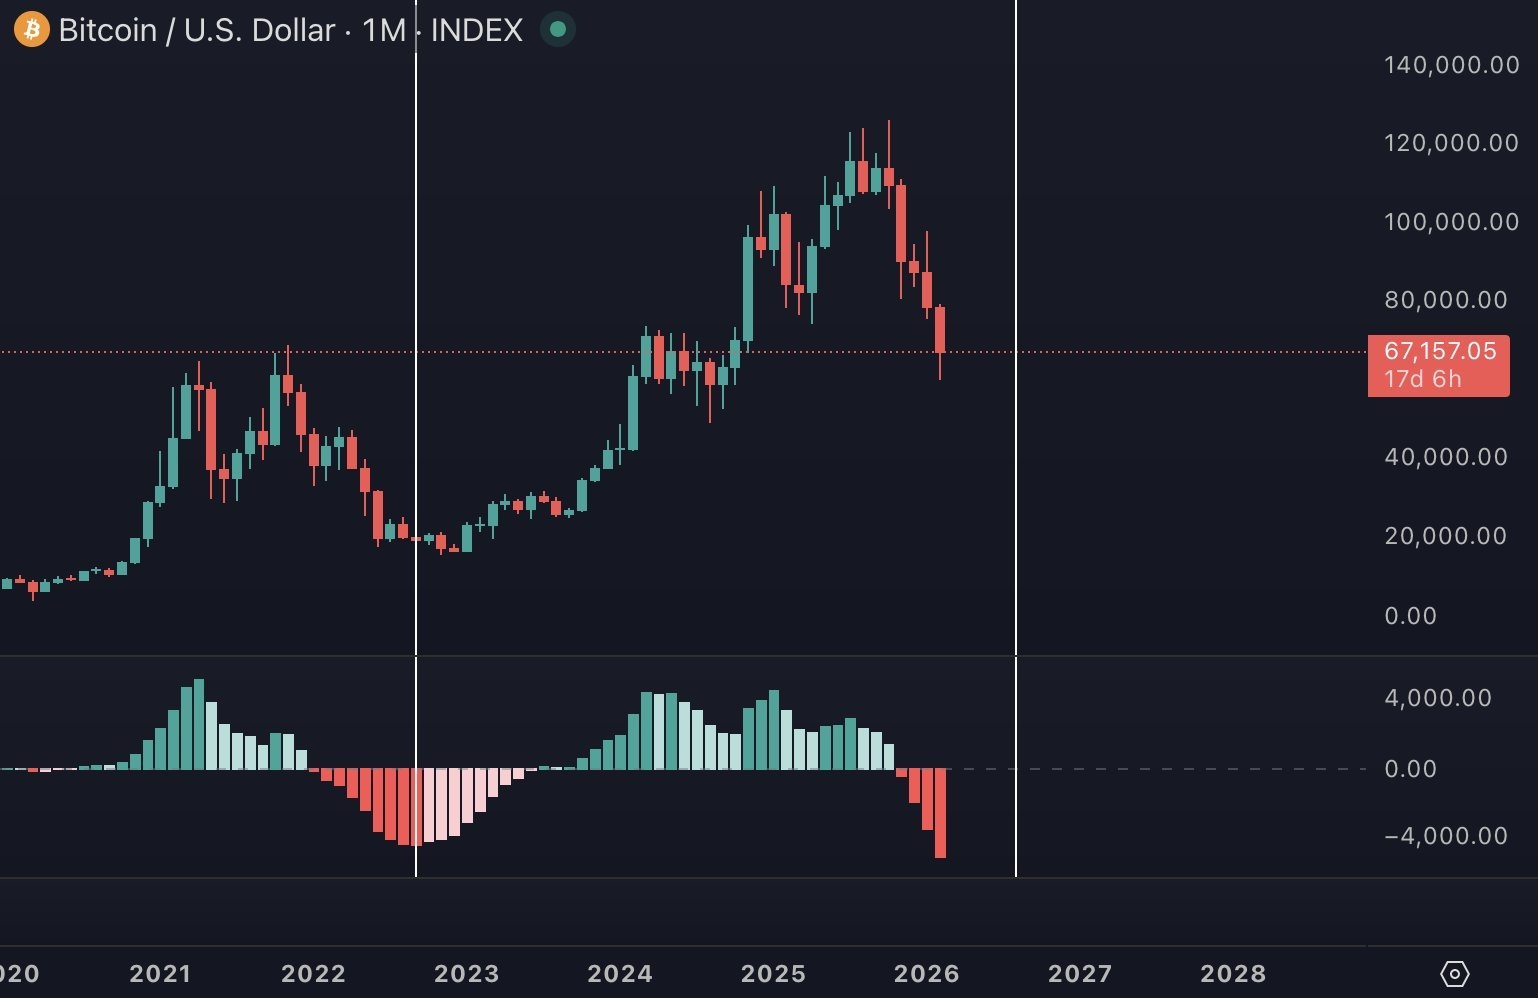
In the previous Bitcoin cycle (the cycle that reached its peak in 2021), the MACD indicator on the monthly timeframe recorded an exceptional series of 9 consecutive red candles on the histogram (meaning 9 consecutive months of negative readings below the zero line)
This phenomenon was not just a passing technical signal, but one of the strongest signs that preceded the historic bottom of the bear market.During the 2017–2021 cycle, Bitcoin reached an all-time high near $69,000 in November 2021. After that, a violent correction phase began that gradually turned into a full bear market
The monthly MACD histogram (which reflects momentum and the difference between the 12- and 26-month exponential moving averages with a 9-month signal line) began shifting negative at an accelerating pace
This negative trend continued for 9 consecutive months, with the histogram remaining below the zero line without any noteworthy positive signal
This long series of red candles on the monthly MACD reflects prolonged weakness in bullish momentum and is often associated with large price declines accompanied by accumulating selling pressure
During that period, Bitcoin’s price fell more than 75% from the peak, reaching a bottom around $15,500–$16,000 in November/December 2022
Notably, the bottom formed shortly after completing that sequence of nine consecutive monthly red candles on MACD.In previous cycles as well, we find similar patterns but to varying degrees
For example, in the 2018–2019 bear market, the negative histogram persisted for several consecutive months before beginning to converge toward zero and then crossing positive, signaling a trend reversal
As for the current cycle (2025–2026), some analysts are watching for the reappearance of similar signals, where continued negative histogram readings for extended periods (whether 5, 7, or 9 months) is considered an indicator of approaching the final capitulation phase, which often precedes major bottoms
Why is this pattern considered powerful? Because the monthly MACD is a relatively slow indicator that captures major trends rather than daily fluctuations
When it continues producing negative readings for 9 consecutive months, it means the structural weakness in the market has reached its peak, and most potential buyers have either exhausted or withdrawn, opening the door for a strong rebound once momentum begins to return.In the end, the previous cycle demonstrated that Bitcoin often bottoms shortly after ending a long series of red candles on the monthly MACD (such as the 9 consecutive ones)
This pattern is used as a tool to identify long-term accumulation zones, where many seasoned investors see such periods as historic buying opportunities before the next bullish cycle begins
Of course, there is no absolute guarantee in markets, but history shows a noticeable repetition of this behavior across previous Bitcoin cycles
#BitcoinGoogleSearchesSurge #RiskAssetsMarketShock #MarketCorrection
