The price $SOL has been under significant pressure during the recent trading sessions. The asset reached price levels not seen in the market for almost two years. A sharp decline occurred against the backdrop of overall cryptocurrency market volatility, leading to a breach of key support zones.
Despite a significant correction, the first signs of stabilization are beginning to emerge. Historical patterns suggest that Solana is preparing for a recovery. This could lead to quotes returning to the psychologically important level of $100.
Indicators of the asset's undervaluation and market cycles
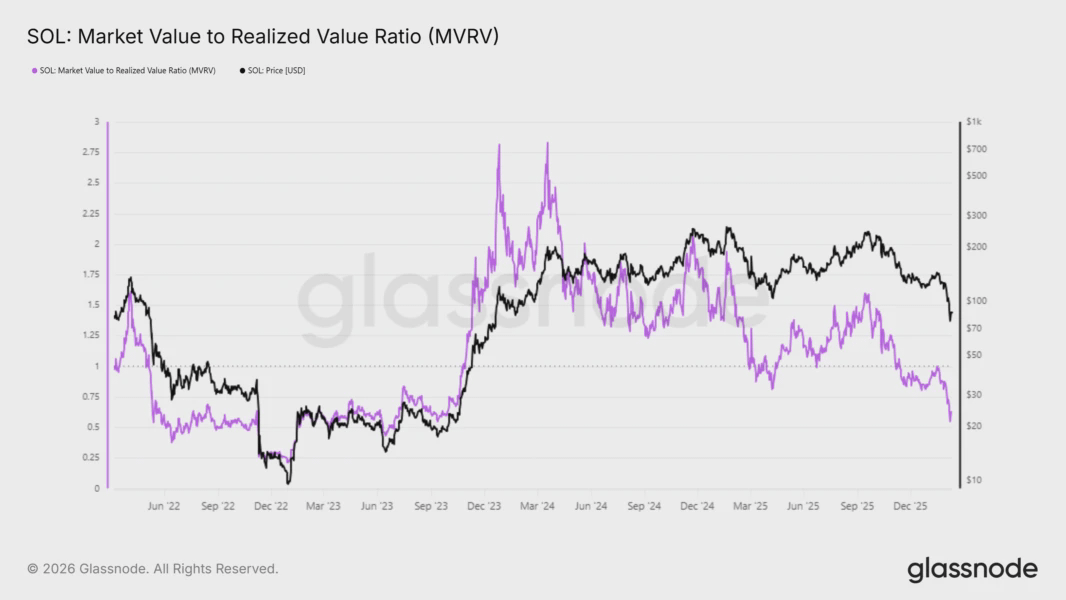
On-chain metric analysis indicates that Solana is in a state of deep undervaluation. The market value to realized value (MVRV) ratio has fallen to a minimum over the past two and a half years. This figure shows that the current market capitalization of the asset is significantly below the total acquisition cost of tokens by market participants.
Such market conditions are characteristic of the final stages of correction. When the realized value exceeds the market value by such a margin, selling pressure usually weakens. Investors show less willingness to realize losses, creating a foundation for price stabilization. Therefore, the current imbalance confirms the view of trading the asset below its fair value.
Holder yield statistics and bottom formation
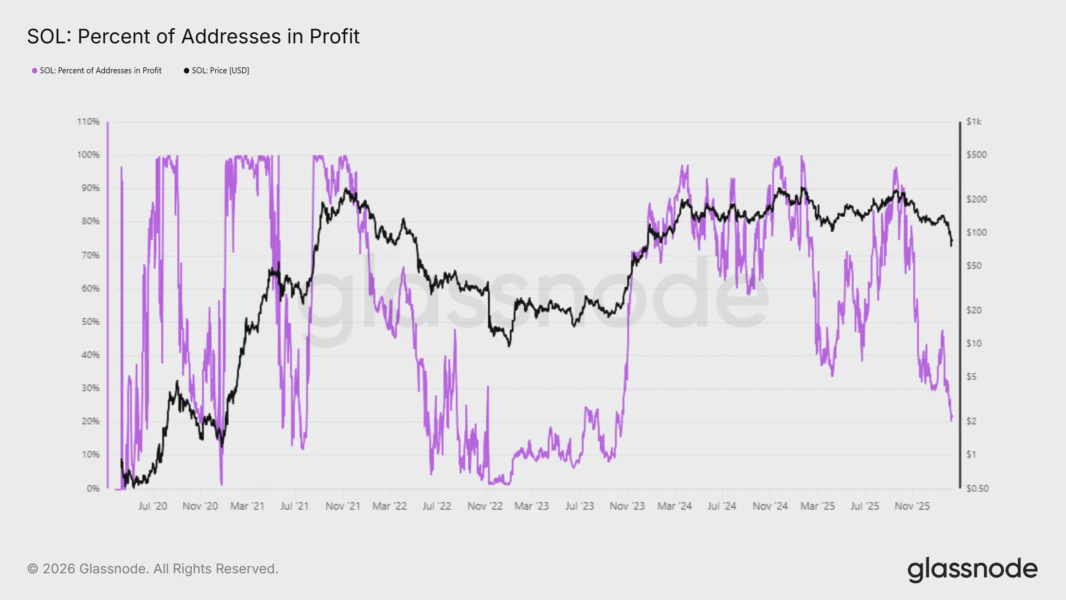
Wallet profitability data strengthens the positive outlook. Currently, only 21.9% of Solana addresses are in profit. This means that over 78% of holders have faced unrealized losses. Such a high level of financial stress among market participants often coincides with the formation of a local bottom.
In previous cycles, a drop in yield below the 20% mark preceded the beginning of a large-scale recovery. The decrease in the share of profitable positions limits supply in the market as asset owners shift to a holding strategy. At the same time, low prices begin to attract the attention of institutional investors focused on long-term investments.
Technical analysis and conditions for price impulse
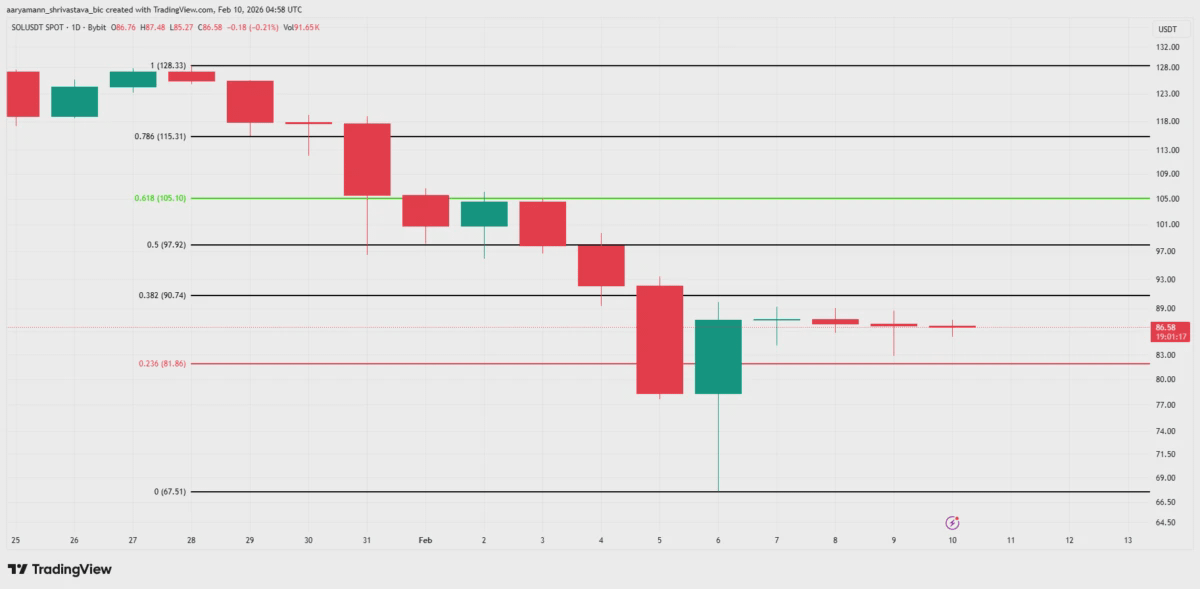
At the time of preparing this material, Solana is trading in the range of $86, holding above the 23.6% Fibonacci correction level. This zone is traditionally considered support within a downward trend. As long as quotes remain above this value, the likelihood of a technical rebound outweighs the risks of further collapse.
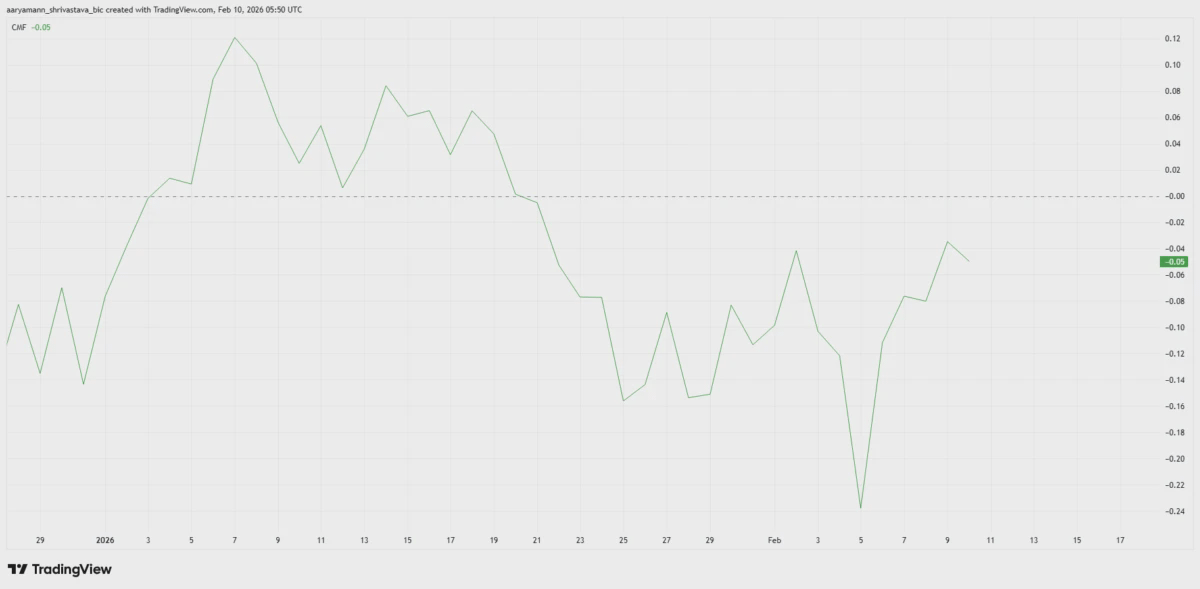
The process of bottom formation is confirmed by the Chaikin money flow (CMF) indicator. Despite being in the negative zone, the indicator shows an upward trend. This signals a slowdown in capital outflow and a gradual decrease in seller activity.
To confirm the growth phase, the asset needs to make a strong move above $90. A definitive signal for a trend change will be consolidation above the $105 level. However, the lack of liquidity inflow may negate current progress. If it falls below $81, quotes risk continuing to decline to $75 or $70.
