
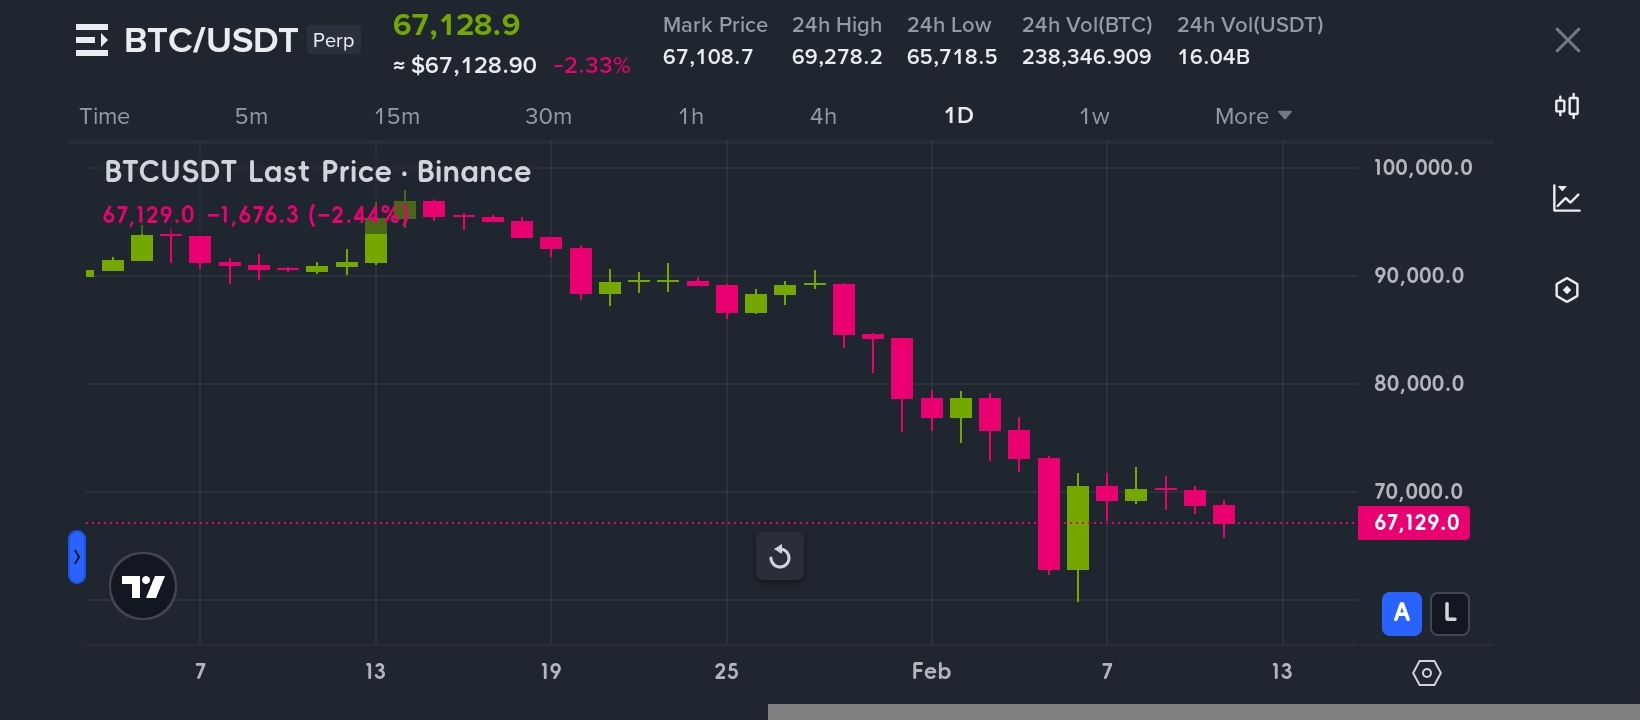
$BTC Bitcoin didn't just drop 38% from its January highs. It exposed something far more revealing about where this market actually stands.
Right now, everyone's watching $63,000 like it's some magic number on a chart. And yeah, the cost-basis data makes that zone important a thick cluster of supply changed hands right around there, which means a lot of wallets are sitting near their break-even. But fixating on the number misses the bigger question: what happens underneath that level if it cracks?
The Bounce That Wasn't
Let's talk about what happened between $60K and $72K, because the way most people interpreted that move was wrong.
Price climbed. People exhaled. Crypto Twitter got optimistic again. But the structure of that rally told a different story. It moved in an overlapping, corrective pattern not the clean, aggressive impulse you'd expect from genuine demand returning. What formed instead was a textbook bear flag: a brief upward drift inside a dominant downtrend.
That flag broke to the downside. And once it did, the conversation shifted from "is the correction over?" to "how far does this actually go?"
Momentum told the same story before price confirmed it. RSI was printing lower highs while price held relatively steady a quiet divergence that doesn't scream panic but absolutely whispers erosion. The kind of signal that doesn't make headlines until after the damage is done.
The Behavioral Crack Nobody's Talking About Enough
Here's where it gets uncomfortable.
Long-term holders the cohort that historically acts as Bitcoin's shock absorber during drawdowns have pulled back from aggressive accumulation. Thirty-day accumulation trends have thinned out noticeably, which tells you something about the temperature of conviction at these prices.
And it's not just that they've slowed down. Net selling pressure from longer-duration wallets has started ticking up. Not panic selling. Not capitulation. Something more subtle and arguably more dangerous: quiet distribution.
At the same time, a growing share of circulating Bitcoin now sits with recent buyers. This is the fragility variable that technical analysis alone can't capture. Short-term holders react faster to drawdowns. They set tighter stops. They sell into weakness rather than buying it. When the ownership mix tilts toward newer hands, the floor becomes thinner even if it looks solid on a chart.
This is why the $63K zone matters beyond just being a line on a screen. It represents a psychological boundary where a large concentration of participants either defend their cost basis or abandon it. Those are two very different market states, and the transition between them can happen fast.
Two Paths From Here
If the $63K region absorbs selling pressure and holds on both daily and weekly closes, the scenario is straightforward enough. Consolidation develops. Volatility compresses. Short-term panic fades. The market gets boring for a while which, historically, tends to precede the next meaningful move up.
But if it gives way with conviction? That's a different animal entirely.
A clean break below that cost-basis cluster doesn't just mean lower prices. It means a significant chunk of the network suddenly sits underwater, and underwater holders behave differently than profitable ones. Liquidity dries up below heavy cost-basis zones because there's less organic demand waiting underneath. The path toward the mid-$50,000s opens up quickly in that scenario, and depending on how aggressively liquidations cascade, a reset into the low $40,000s isn't some fringe prediction it's a structurally logical outcome.
What Would Actually Flip the Script
Bears don't stay in control forever, and there are specific levels that would signal the correction is losing steam.
First: Bitcoin needs to reclaim and hold above the low $70,000s. Not a wick. Not a brief spike on a thin weekend order book. A sustained close above that range would indicate real demand is stepping back in and absorbing supply.
Second: the upper $70,000s need to break. The current correction has established a clean series of lower highs, and until that pattern is disrupted, every rally exists within the context of a downtrend. Breaking the upper $70Ks would invalidate the lower-high sequence and open the door for a genuine trend reversal.
Until both of those conditions are met, the base case remains that bounces are selling opportunities for the broader market structure not confirmation of a bottom.
This Isn't a Dip-Buying Playbook
There's a temptation to frame every significant drawdown as an opportunity. And sometimes it is. But markets that are transitioning from accumulation to distribution don't reward aggressive positioning they punish it.
The important thing right now isn't picking a bottom. It's reading the behavioral data honestly. Long-term capital is less aggressive than it was three months ago. The holder composition has shifted toward participants with weaker hands. Technical structure favors continuation of the downtrend until proven otherwise.
None of this means Bitcoin is broken. It means the market is going through a stress test, and the outcome depends on whether real conviction shows up at the levels that matter or whether those levels turn out to be nothing more than lines on a chart.
Support doesn't exist because of where price has been. It exists because of who's willing to buy there again.
