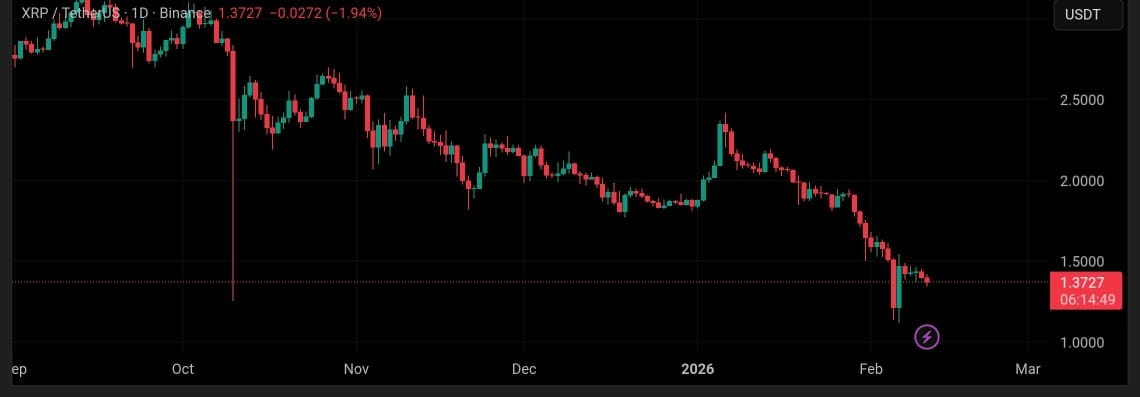
XRP is currently trading around $1.37, down about 2% over the past 24 hours, after slipping below the descending trendline that has shaped price action since July. This drop comes despite Goldman Sachs revealing $153 million in XRP exposure via regulated ETFs, as ongoing spot outflows and weakening technical signals continue to weigh on the asset.
Over the past few weeks, XRP has quietly outperformed many large-cap alts. The rebound has been strong on a percentage basis, and liquidity remains healthy, with XRP still sitting comfortably among the top cryptocurrencies by market cap. That said, it’s worth keeping perspective: price is still well below its 2025 all-time high, reminding us that this is a recovery phase, not a confirmed new trend yet.
From what I’ve seen, sentiment is cautiously bullish. Long-term holders seem confident, but retail participation feels muted, something that often happens after sharp drawdowns when confidence needs time to rebuild.
What Caused the Recent Drop?
Zooming out, XRP recent weakness is part of a larger correction. After peaking in mid-2025, the token suffered a deep drawdown of roughly 60%, bottoming in early February before staging a sharp rebound.
This kind of V-shaped bounce tends to attract skepticism, and rightly so. Derivatives markets remain cautious, and a lot of the selling pressure appears to have come from holders exiting into strength after being underwater for months. I’ve seen this pattern many times, relief rallies often become exit points before a real trend reversal forms
On-chain data supports this view. XRP briefly slipped below its aggregate holder cost basis, a sign that many participants were selling at a loss. Add in broader market liquidations and leveraged long flushes, and the recent dip makes sense.
Whale activity has also picked up. Large transfers don’t automatically mean bearish intent, but when they coincide with heavy distribution, it suggests the market is still searching for balance rather than exploding upward.
Technical Picture: Cautiously Constructive
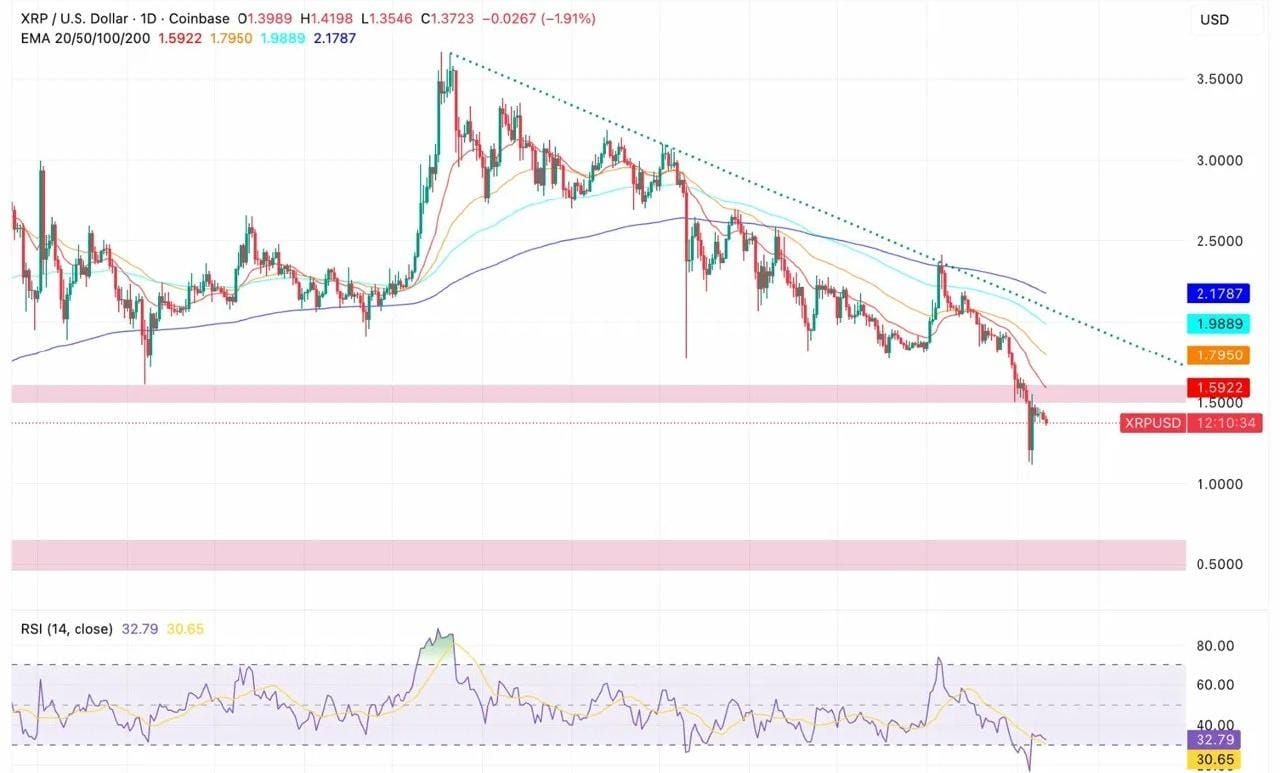
On the daily chart, XRP has slipped below all its major moving averages, which is a clear sign of weakness. The 20-day EMA is around $1.59, followed by the 50-day near $1.80, the 100-day just under $2.00, and the 200-day close to $2.18. With all four averages sloping downward and stacked above price, they now form a strong resistance zone overhead.
A few things stand out on the chart:
• Price has broken below the descending trendline that’s been in place since the July high
• Several recent attempts to reclaim the 20-day EMA have failed
• The former support area around $1.50 is now under pressure
XRP has officially lost the $1.50 support, which held for most of January. This breakdown puts price at its weakest level since late 2024 and shifts focus toward the $1.35 psychological zone. The RSI is currently near 32.8, hovering close to oversold territory, but it hasn’t shown any clear reversal signals yet.
If XRP closes a day below $1.35, it would confirm a deeper breakdown and open the door to the next major demand area near $0.50, where price previously consolidated before the July rally. Until XRP can reclaim the 20-day EMA around $1.59, the overall structure remains firmly bearish.
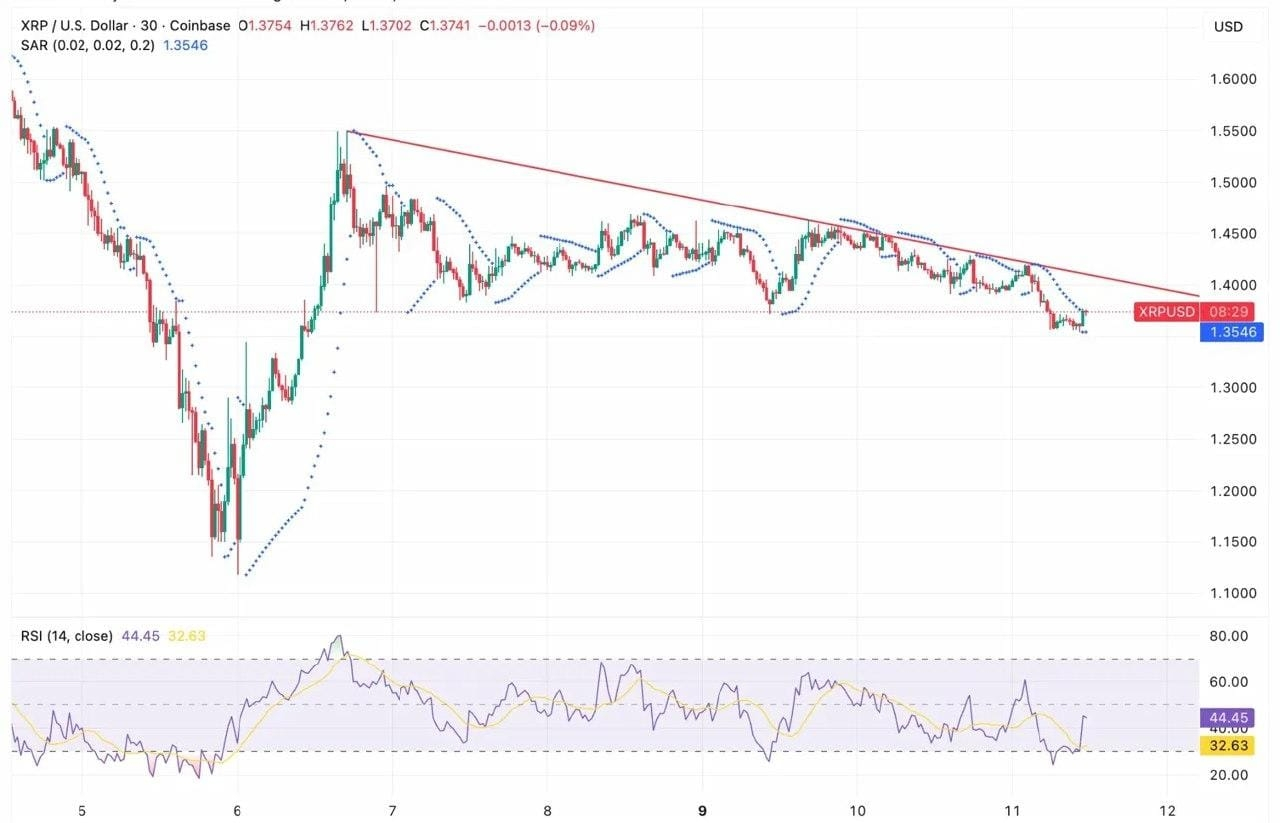
On the 30-minute chart, XRP is hovering around $1.37, testing short-term support after breaking below the descending trendline. The Parabolic SAR dots have flipped above price (around $1.35), which confirms bearish momentum in the near term. RSI is sitting at 44, still neutral but trending lower, showing that sellers are stepping in on every bounce.
What the structure is telling us:
• Price is trading below the descending resistance line
• Lower highs have been forming since February 9
• Parabolic SAR turned bearish after multiple failed breakout attempts
For momentum to stabilize, buyers need to reclaim $1.40 and push price back above the descending trendline. Until that happens, any upside move looks more like a short-lived relief bounce rather than a real trend change. There’s no sign of panic selling yet, but there’s also no clear demand stepping in to defend current levels.
Outlook: Can XRP Move Higher?
The next move really comes down to how price reacts around the $1.35 support zone.
Bullish scenario:
If XRP holds $1.35 and manages to close back above $1.40, especially with a break of the descending trendline, momentum would shift closer to neutral. That would bring $1.50 back into play. A reclaim of $1.59 would be the first real signal that the broader downtrend is losing steam.
Bearish scenario:
A clean daily close below $1.35 would confirm a breakdown and expose the $1.00 psychological level, with the $0.50 demand zone from mid-2024 becoming a longer-term downside target. Losing $1.35 would mark a fresh multi-month low and keep pressure firmly on the downside.
For now, XRP remains in a fragile spot, support is being tested, but buyers still need to prove they’re willing to step in.
Fundamentals: Quiet Progress Beneath the Surface
Fundamentally, Ripple continues to build, even while price chops around.
There’s growing speculation around a potential Ripple IPO, which could shine a spotlight on the XRP ecosystem if structured favorably. On top of that, XRPL adoption is expanding through tokenization efforts and institutional partnerships. These developments don’t always move price immediately, but they matter over a longer horizon.
That said, XRP still faces challenges. Competition in the payments and tokenization space is intense, and confusion around fake or unofficial tokens hasn’t helped sentiment. ETF flows have also been underwhelming so far, limiting fresh demand.
In my view, XRP fundamentals are improving faster than its price reflects but markets often take time to reward that.
Sentiment and Price Expectations
Market opinions are split. Some traders see the recent pullback as a textbook accumulation zone, while others remain cautious due to weak retail participation and lingering resistance overhead.
Short term, a push to $2 looks unlikely without a clear breakout. Medium term, however, a confirmed break above resistance could open the door toward the $2.50–$3.00 range. Longer-term projections for 2026 vary widely, which tells me uncertainty is still high.
Personally, I treat this phase as high-risk, high-potential. XRP doesn’t look dead, but it also hasn’t proven itself yet.
Final Thoughts
XRP appears to be in a corrective, rebuilding phase rather than a full-blown downtrend. Technical setups suggest upside is possible if key levels hold, while fundamentals continue to strengthen quietly in the background.
That said, volatility remains elevated. This is not a “set and forget” environment. If accumulation is happening here, it’s happening slowly and selectively, not through explosive retail hype.
For me, XRP in 2026 is a patience trade. If support holds and broader market conditions improve, the upside could be meaningful. If not, another shakeout wouldn’t be surprising. Watching whale behavior, volume expansion, and institutional flows will be critical from here.
