If you look at the chart as just a set of red or green candles, you will always be in the role of a guesser. In fact, each pattern is a frozen emotion: collective fear, greed, and those moments when large players run out of strength.
I collected a base of 16 key formations that really work — provided that you understand the logic behind them, and not just look for geometric shapes in empty space. 👇
📸 Part 1. When the trend takes a break (Triangles and wedges)
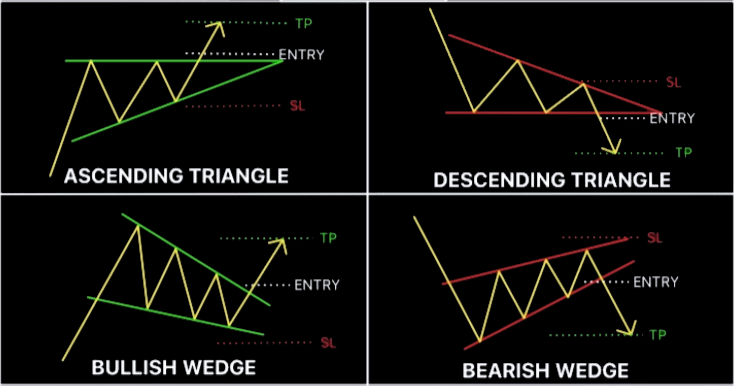
Here, the market is 'squeezing' before the explosion.
Ascending triangle: The seller is sitting on top and not letting the price go, but buyers are buying the bottom higher and higher. Sooner or later, the seller will be 'eaten'. Entry: on the breakout of the upper boundary.
Descending triangle: Everything is reversed. The buyer holds the 'floor', but the pressure from the bears is growing. This usually ends with a painful drop down.
Bullish wedge: Price is squeezed in a narrowing channel after a rise. It looks like a drop, but in fact — it is accumulation of strength before a new surge.
Bearish wedge: Price crawls up in a narrow channel, suffocating from lack of volume — wait for a collapse.
Ascending and descending triangles are my favorites.
📸 Part 2. Flags and waiting phase
Bull flag: A sharp rise (flagpole), followed by a slight wobble. This is just profit taking before the next upward shot.
Bear flag: A sharp drop and a weak 'dead cat bounce' in the channel. Usually leads to a new wave of sales.
Bullish symmetrical triangle: The market is holding its breath. During an uptrend, it often shoots upwards.
Bearish symmetrical triangle: Consolidation during a decline, which usually ends with a new wave of selling.
Of these patterns, I trust the bull and bear flags more.
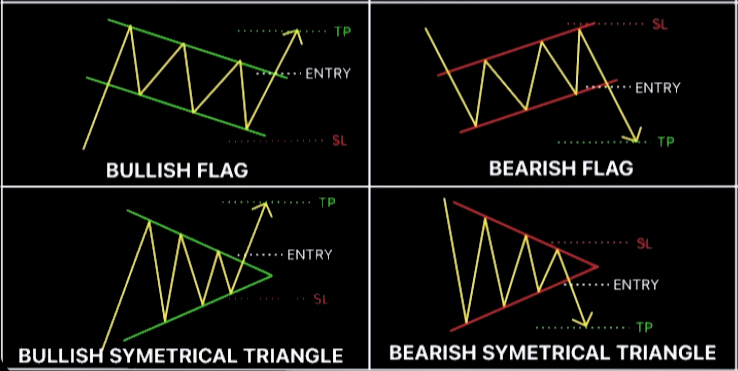
📸 Part 3. Classic reversal (Tops and bottoms)
A story about how the market 'could not'.
Double bottom (Letter W): The seller is exhausted. We hit the floor twice, and no one wants to sell below.
Double bottom (Letter W): The seller is exhausted. We hit the floor twice, and no one wants to sell below.
Triple bottom: A solid buying zone, where the level has been tested three times and held.
Triple top: An even stronger resistance signal. Buyers have stormed the level three times and gave up.
I like all these patterns, the double bottom occurs more often than the triple bottom, in my opinion, these are some of the main patterns.
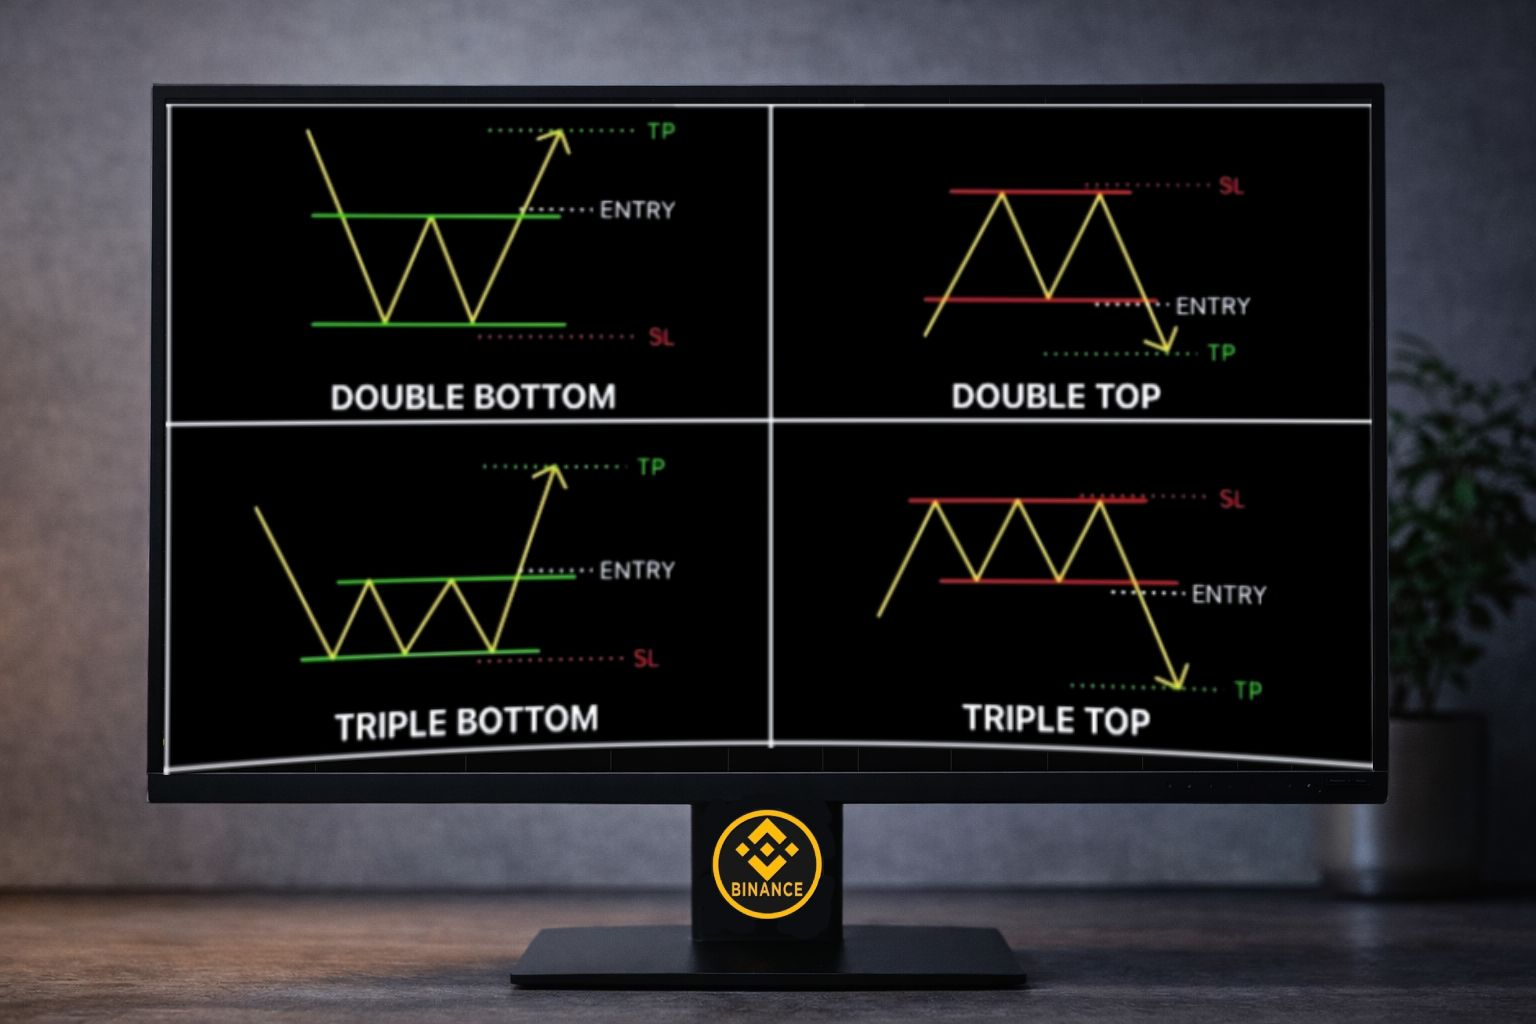
📸 Part 4. Heavy artillery (Structure break)
If you see this — it means the global market sentiment is changing.
Head and shoulders: Did you see this at the peak? Pack your things and go into cash. The trend is structurally broken.
Inverted 'Head and Shoulders': The most reliable sign that the macro trend is changing from bearish to bullish.
Rising wedge: A slow rise 'wedged', which almost always ends with a technical breakout down.
Falling wedge: A long narrowing slide, which often ends with a sharp reversal upwards.
From this selection, my favorites are head and shoulders and falling wedge.
What should be said at the end?
Patterns are not magical spells, but probabilities. They do not work 100% of the time. The biggest mistake is 'stretching' a pattern where there isn't one, just because you really want to hit the 'buy' button.
First, look at the context (overall trend), and use the pattern only for confirming entry.
I will note that these patterns work on a timeframe of 1 hour.
Which of these 16 patterns do you trust the most? Or are you one of those who trade only pure charts? I await your comments. 👇


