The Current Landscape: A Steep Correction
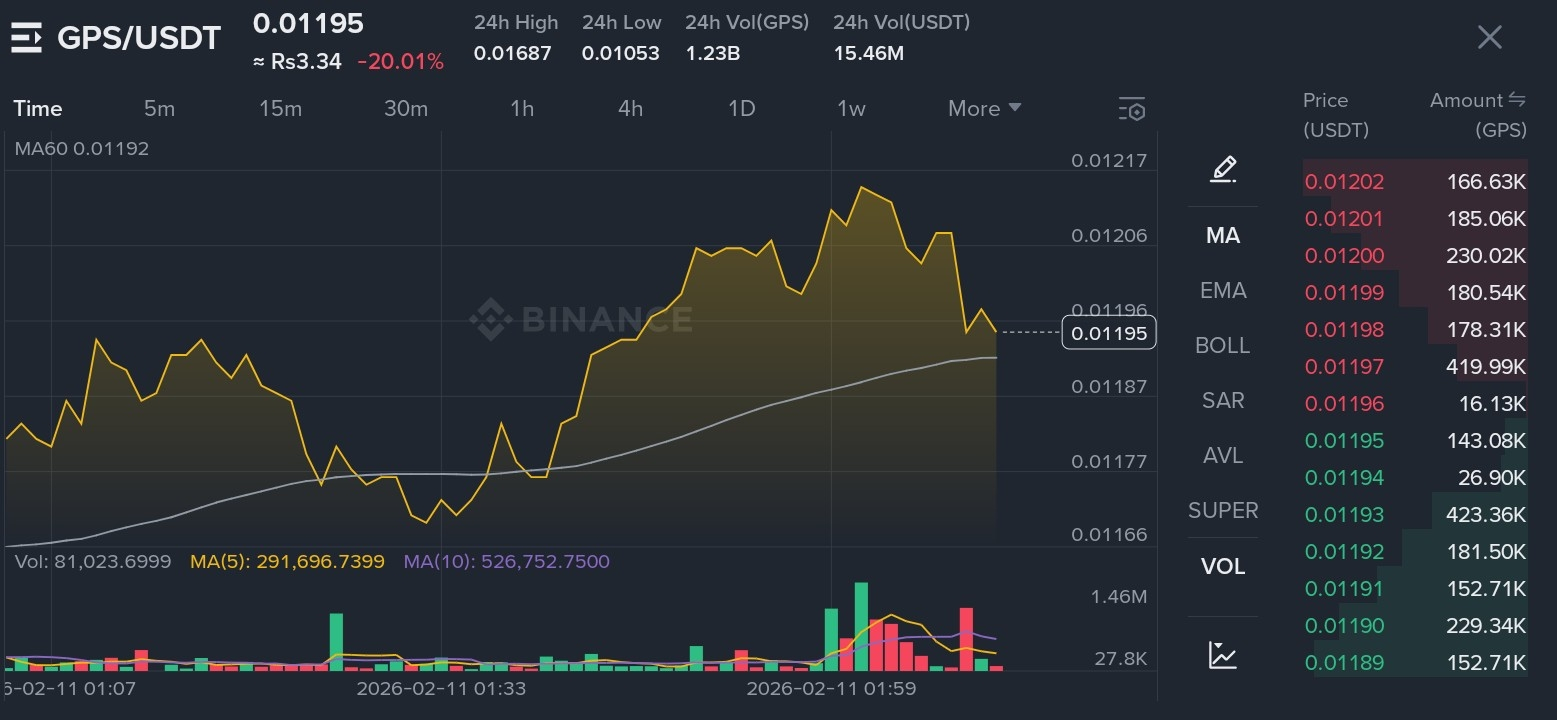
The digital asset market is no stranger to rapid price shifts, and today, GPS/USDT is taking center stage with a significant correction. At the time of the data capture, $GPS is trading at $0.01195, marking a sharp 20.01% decline over the last 24 hours. While a double-digit drop can be jarring, it’s essential for disciplined traders to look past the red numbers and dive into the mechanics of the price action. 📊
The screenshot reveals a 24-hour high of $0.01687 and a low of $0.01053. This tells us that the "flush out" was even deeper earlier in the session, and we are currently seeing a slight consolidation above those local lows. 🕯️
Technical Breakdown: Moving Averages & Volume
One of the most telling indicators on this chart is the MA60 (Moving Average), currently sitting at approximately $0.01192. We can see that the price is currently dancing right on top of this line. 🧐
Support Test: The fact that the price is hovering near the MA60 suggests this is a critical "make or break" zone. If the bulls can hold this level, we might see the formation of a base for a potential relief rally. 🛡️
Volume Profile: The volume bars at the bottom show significant spikes during the downward moves. This indicates high selling pressure, likely driven by stop-losses being triggered or profit-taking after a previous run-up. However, notice the green volume spikes near the end—this suggests that "dip buyers" are starting to step in at these discounted levels. 📈
Order Book Insights: Looking at the depth on the right, there is a concentrated cluster of buy orders (bids) around the $0.01190 - $0.01193 range. Conversely, resistance (asks) is stacking up heavily near $0.01200. Breaking through that psychological 0.012 level is the first hurdle for a recovery. 🧱
Understanding the "Why": Sentiment vs. Structure
A 20% drop usually implies a shift in short-term sentiment. Whether this was a "sell the news" event or a broader market correlation, the technical structure has shifted from a parabolic uptrend to a corrective phase. 📉
When an asset drops this quickly, it often leads to an "oversold" condition on shorter timeframes (like the 5m or 15m). Professional traders often look for a Mean Reversion—where the price attempts to snap back toward the moving averages after being extended too far to the downside. 🔄
Strategy & Outlook: What’s Next for GPS?
For those holding or looking to enter, the strategy revolves around Risk Management. 🛡️💼
Watch the Support: If $GPS fails to hold the $0.01190 mark, the next logical area of interest would be a retest of the 24h low at $0.01053.
Confirm the Reversal: Don't catch a falling knife! Wait for a "higher low" on the 15-minute chart or a sustained break above the $0.01206 resistance before assuming the bottom is in. 📉➡️📈
Volume Confirmation: A true recovery needs to be backed by rising green volume. If the price rises on low volume, it might just be a "Dead Cat Bounce" before further downside. 🐱🪂
Final Thoughts
Volatility is the price we pay for opportunity in the crypto space. While a -20% day looks intimidating on a portfolio tracker, it provides a much-needed reset for the RSI and allows for a healthier market structure in the long run. GPS is currently at a crossroads; the next few hours of price action around the $0.0119 level will likely dictate the trend for the remainder of the week. ⏳
Stay disciplined, stick to your stop-losses, and always trade with a plan! 🧠💪
#CryptoAnalysis #GPSUSDT #Altcoins #TechnicalAnalysiss #Binance