This is when I look at the endless indicators, RSI, MACD, and Fibonacci grids, it's easy to lose the essence, but if you remove all this visual noise and leave only the skeleton of the market, the Power Law Bottom appears, that is, the lower boundary of the power law.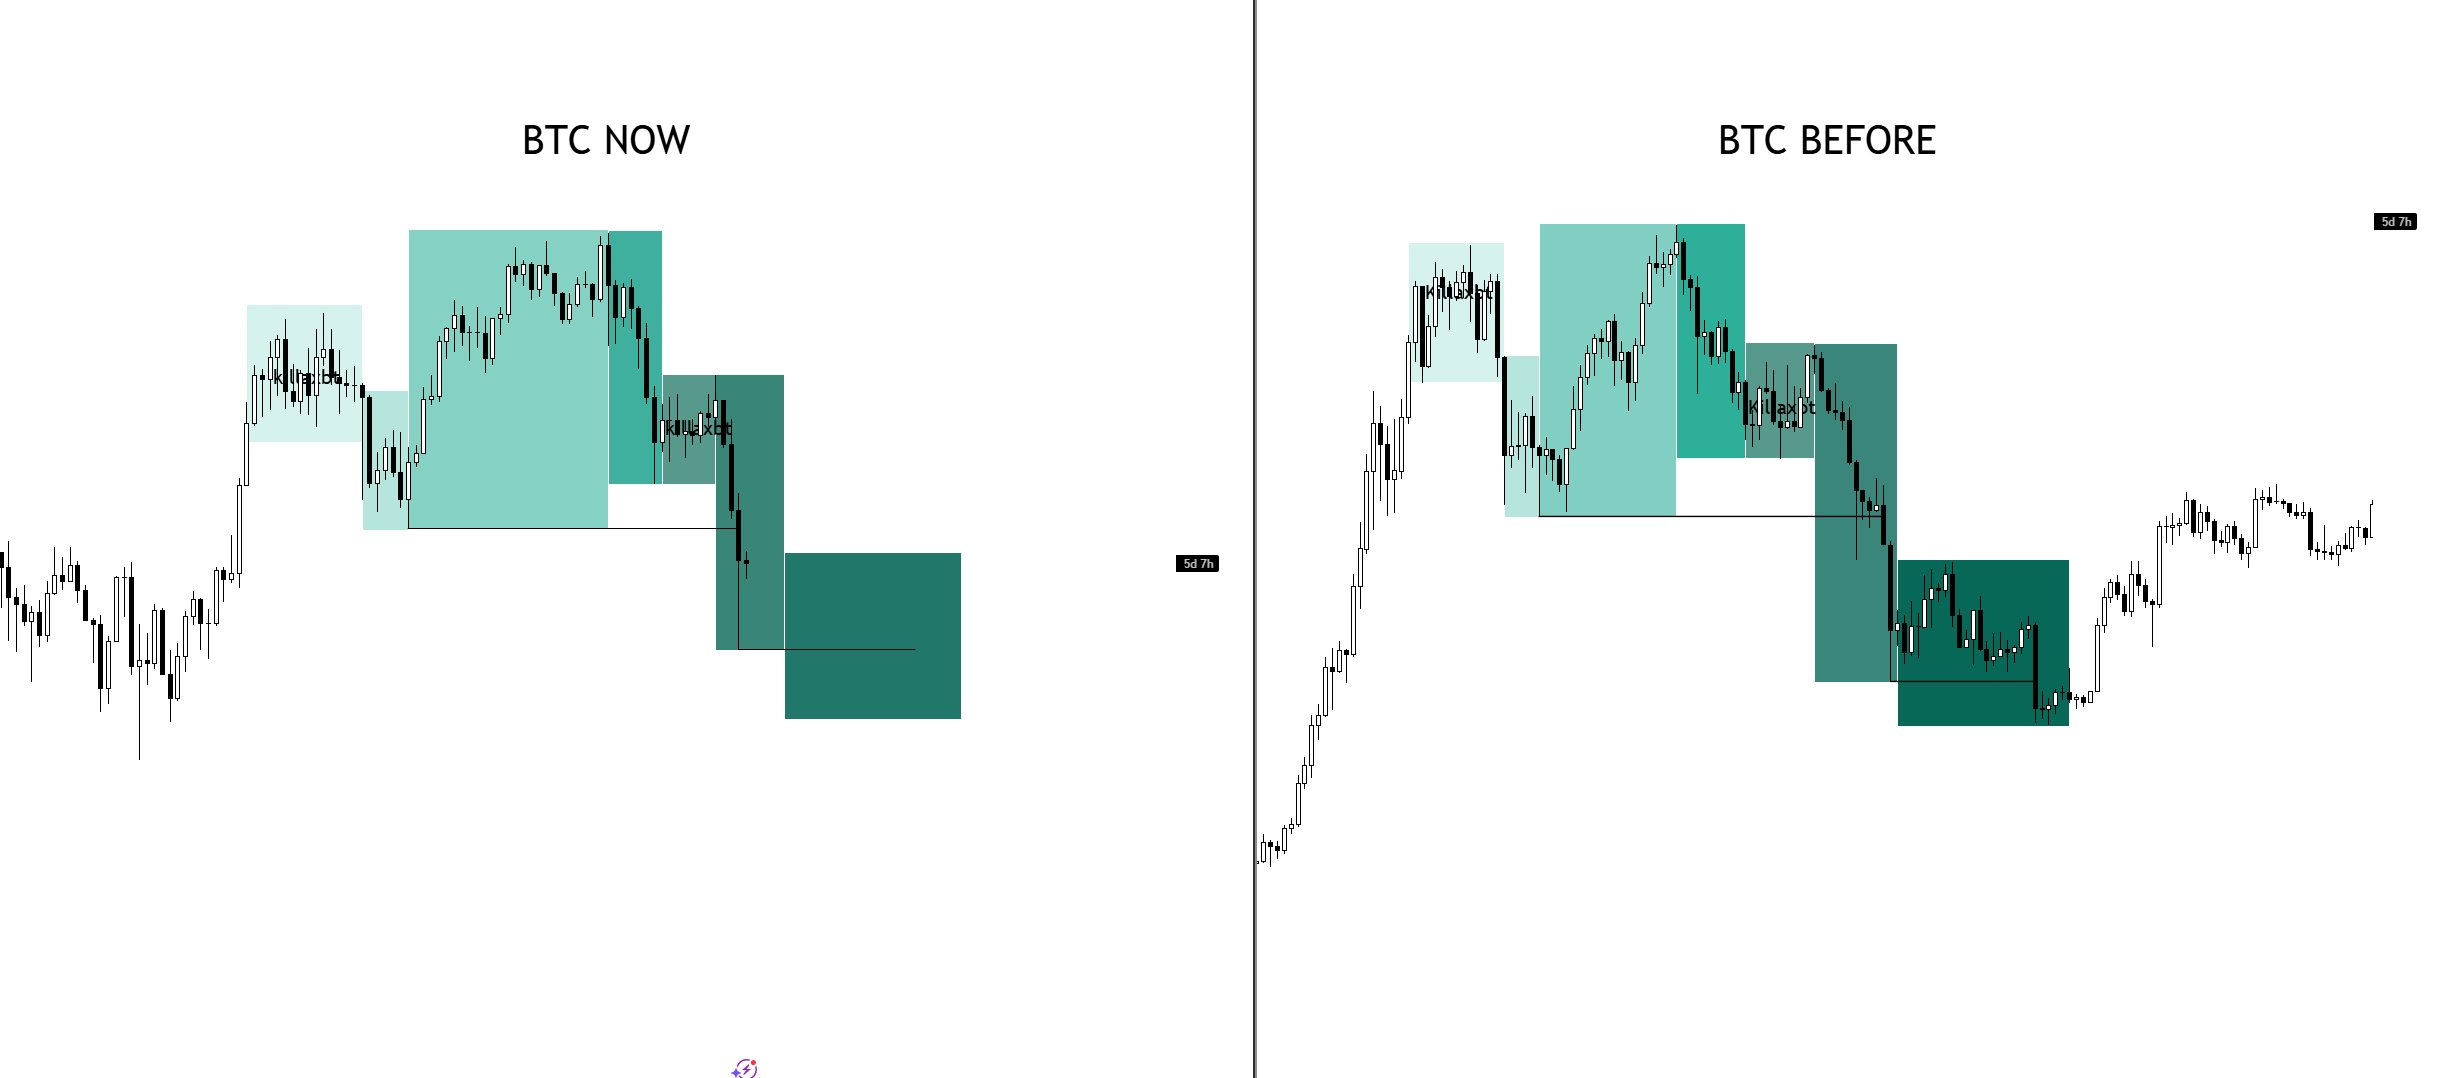
What is the meaning of this image?
In this graph, I compare the current situation BTC NOW with the past cycle BTC BEFORE, and do you know what connects these boxes? They perfectly fit into the mathematical growth model $BTC .
For example, dark green blocks are not random spills; they are moments when the price comes very close to its support.
History shows that as soon as BTC touches the lower boundary mentioned above, a phase of long accumulation begins.
This is exactly what we see on the Before fractal. Those who look for a bottom deeper often remain on the sidelines because the mathematics of the law does not allow the price to fall into infinity.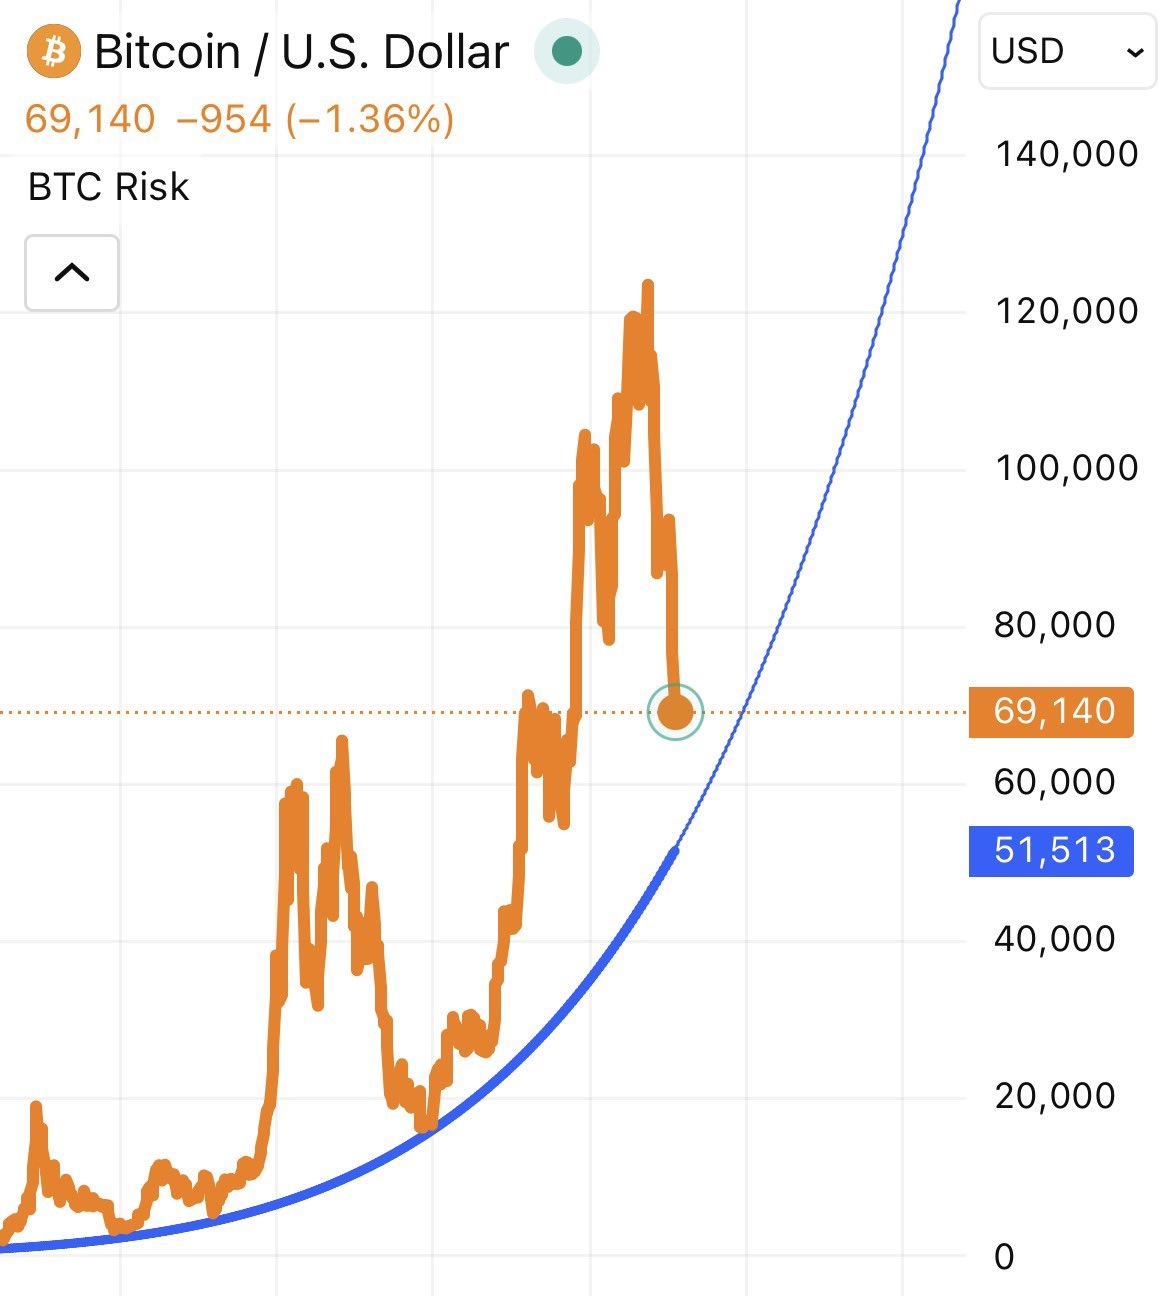
Simplicity is power. The Power Law tells us that time is our main ally. Fractals only confirm that the structure of price movement is cyclical because human psychology and the configuration of trading bots will remain unchanged.
If you understand the theory of the Power Law, then this cut, let's call it that, in the dark green block for you is not a reason to panic, but a time for strategic position building.
We are simply confirming the bottom once again to gather strength for the next upward surge. Bitcoin is not just a currency; it is geometry.
