Bitcoin’s 2026 journey has been dramatic. After reaching $126,000 in October 2025, it lost nearly 45% of its value, briefly dipping below $60,000 in early February before rebounding to around $70,000. This pullback has reignited fears of a deeper crash, with some analysts warning of a return to the $40,000–$60,000 range last seen in early 2025.
While BTC has survived worse drawdowns historically, 50–85% in prior cycles, the current environment feels different: highly institutionalized, macro-sensitive, and leveraged. Let’s explore plausible scenarios, both technical and fundamental.
▪️Historical Perspective: Bitcoin’s Recurring Boom-and-Bust Cycles
Bitcoin’s past is full of dramatic booms and busts, often tied to halving cycle
2018: After the 2017 peak, BTC fell 84% to ~$3,200.
2022: From $69,000 ATH, it dropped 77% to ~$15,500 amid FTX collapse and macro tightening.
2025: Peaked at $126,000, then fell 45%+ mild compared to previous cycles.
If history repeats, a full bear market could erase 60–80% from peak, potentially testing $25,000–$50,000. But this cycle is arguably different. ETFs, institutions, and broader adoption may cap downside around $40,000–$60,000.
Here's a long-term chart showing Bitcoin's historical price action, highlighting major crashes and recoveries
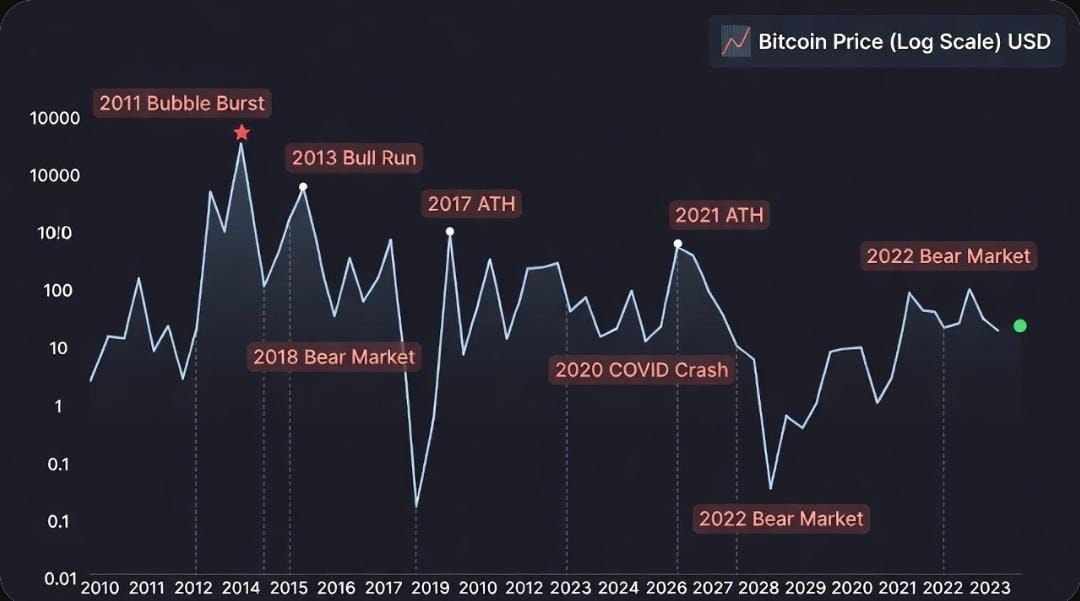
▪️Technical Risks: Patterns Pointing Lower
Bitcoin shows signs of vulnerability
Chart Patterns: Weekly charts hint at a “head and shoulders” breakdown, with neckline support around $70,000 already tested. A confirmed break could see $34,000–$35,000.
Momentum: RSI is oversold but not capitulating; MACD shows bearish monthly crossover, suggesting multi-month weakness.
Support Levels: On-chain supports sit at $60,000 (short-term holder realized price) and $52,000 (100% extension of prior downswing). The 200-week EMA near $68,000 has held so far; a breach opens the $40,000–$50,000 zone.
Cycle Comparison: Post-2024 halving, BTC underperforms prior cycles with muted volatility, pointing to a slow grind lower rather than a quick V-shaped recovery.
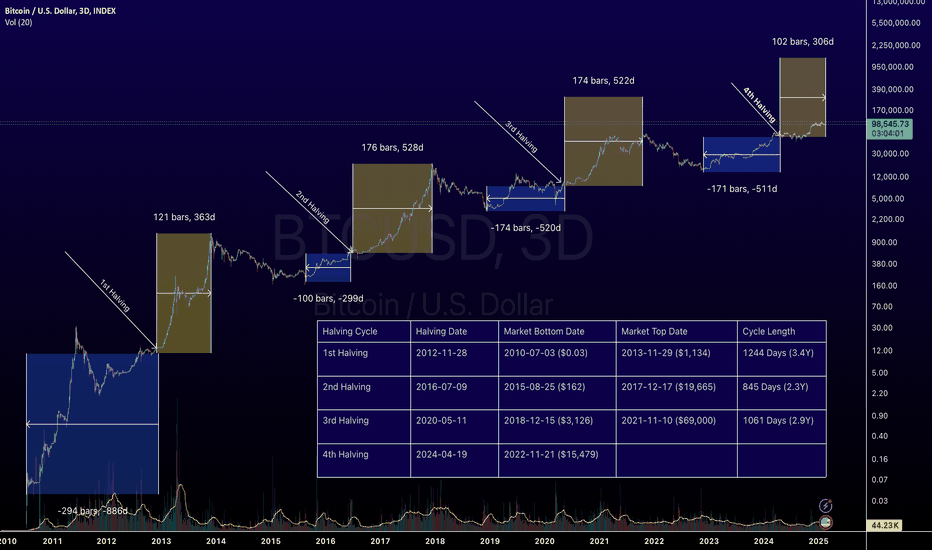
Here's an overlay chart comparing Bitcoin's current halving cycle to previous ones:
 Recent price action (last 2 years) shows the 2025 peak and ongoing correction, with potential for further downside if $60,000 breaks:
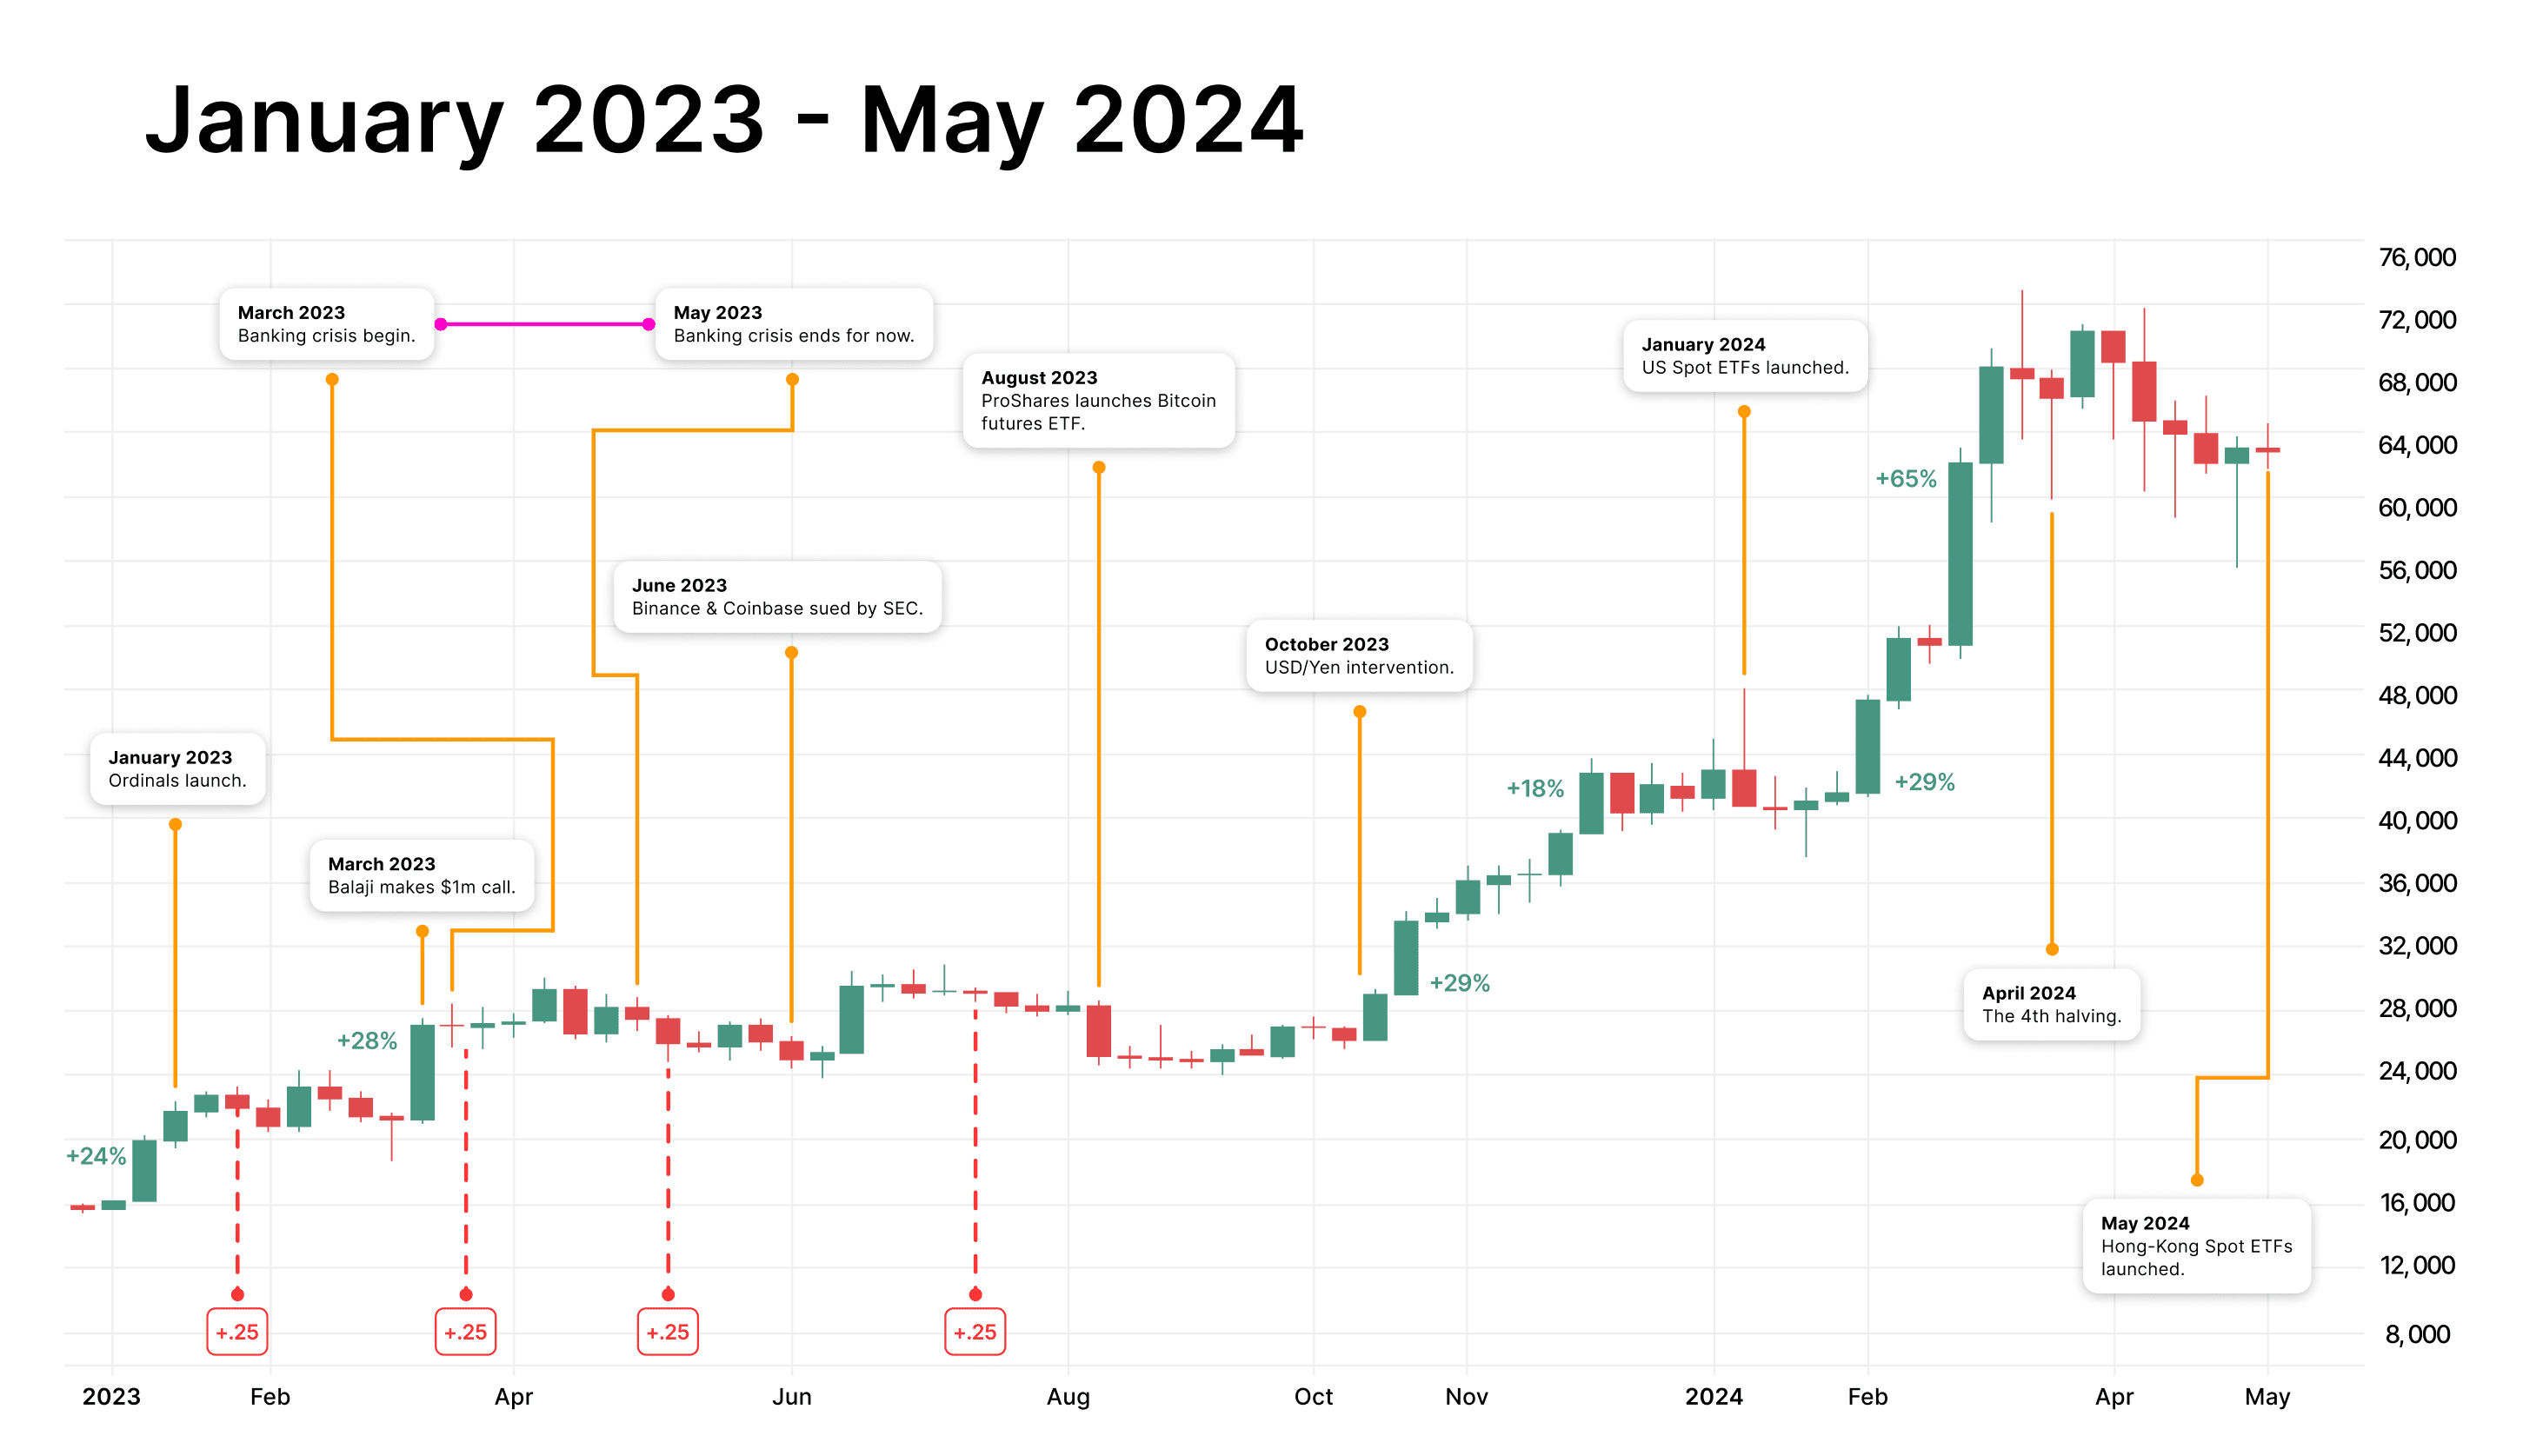
Fundamental Risks: Leverage and Macro Headwinds
Maturing markets bring new vulnerabilities:
Institutional De-Risking: ETFs saw outflows in early 2026, intensifying the sell-off. Without renewed inflows, BTC could slip to $50,000–$60,000.
Leverage Overhang: High leverage in perpetuals and options could trigger cascading liquidations. Debt-heavy holders like MicroStrategy risk margin calls below $70,000, forcing sales.
Macro Pressures: Tight liquidity, rising rates, and geopolitical risks (USD/Yen intervention, stock correlation) could drag BTC to $38,000–$40,000. Corporate treasury selling could add fuel.
Analyst Crash Scenarios: From $34K to $60K
Worst-Case: Gareth Soloway sees $34,000–$35,000 if stocks collapse. Michael Burry flags miner or corporate stress below $60,000.
Base Bear: $50,000–$60,000 range, per Mark Yusko and Peter Brandt.
Bull Counter: Bernstein predicts BTC could reach $150,000 by end-2026, while Polymarket odds favor a recovery to $85,000 (~71% probability).
Final Take
A drop to $40,000–$60,000 is entirely plausible technical breakdowns, leverage unwinds, and macro shocks could drive it there. But Bitcoin isn’t just numbers on a chart; long-term holders are accumulating, volatility is compressing, and market structure is evolving.
For someone like me watching closely, it feels like a reminder: volatility is part of the game. If you’re in for the long haul, this could be a chance to strengthen your position. If you’re trading short-term, patience and discipline are key. Keep an eye on ETF flows, Fed policy, realized prices, and macro liquidity they’ll shape whether BTC grinds higher or tests lower support
