Here’s the Real Market Setup
Market Snapshot
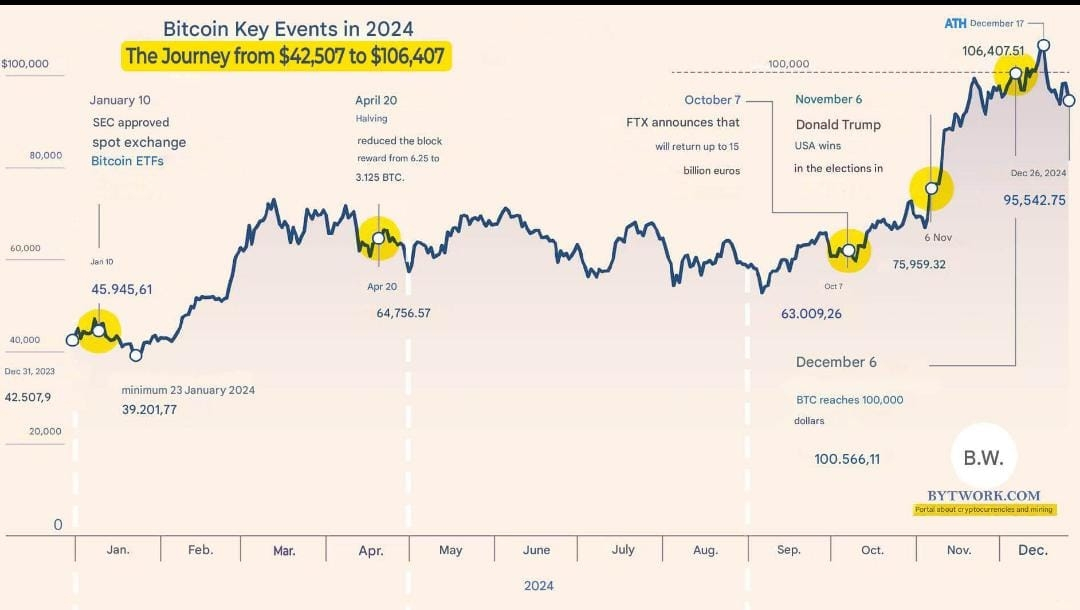
$BTC is currently trading at $69,134, down 1.87% in the past 24 hours.
Over the last week, Bitcoin has pulled back 12.2% from $78K to $69K, triggering rising fear across the market.
The big question now:
Is this just a healthy correction or the start of a deeper drop?
Technical Analysis 📊
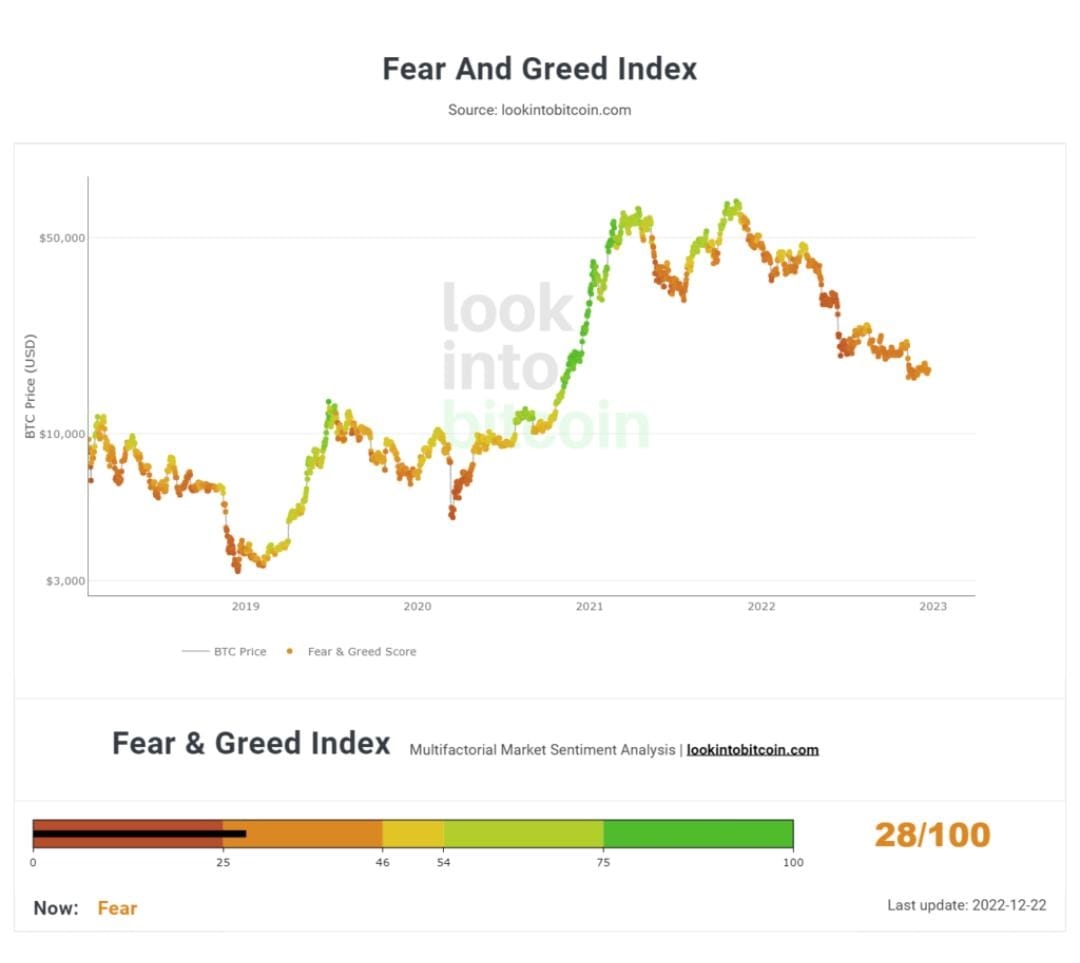
The Bitcoin Fear & Greed Index has plunged to 10 (Extreme Fear) a zone that historically aligns with institutional accumulation, not panic selling.
On the charts:
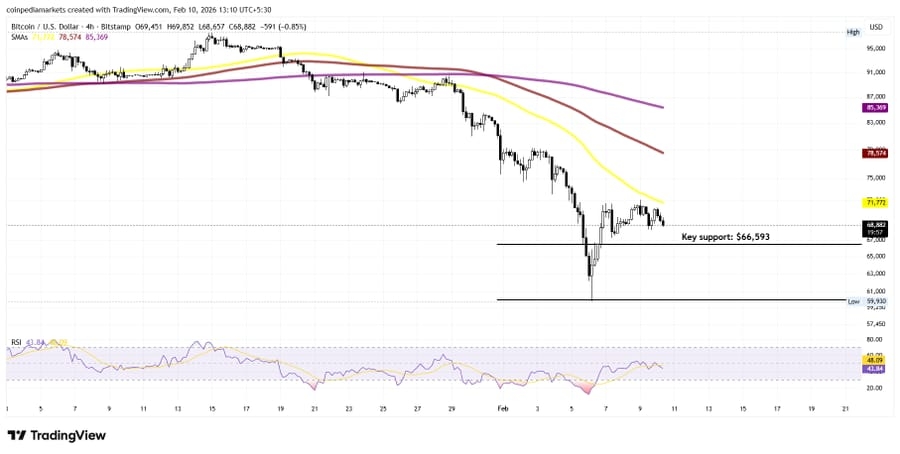
$68K – $66K → Major liquidity + high-timeframe support
This zone represents:
Prior breakout structure
High-volume demand
Smart money accumulation range
A clean loss of $66K could open the door for a liquidity sweep toward $62K – $60K, where massive structural demand sits.
However, as long as BTC holds above this support cluster, this move still looks like a normal bull-market retracement not a trend reversal.
Market Outlook 🔍
A dip to $60K is possible but not guaranteed.
If it happens, it would likely be:
A liquidity grab
A leverage flush
A final accumulation sweep
Not a collapse.
Why?
Macro structure remains bullish
Spot ETF inflows remain steady
On-chain data shows long-term holders are not distributing
Exchange reserves remain near cycle lows
Historically, Extreme Fear zones have delivered the highest risk-reward long entries.
In bull markets:
Fear is where wealth is built.
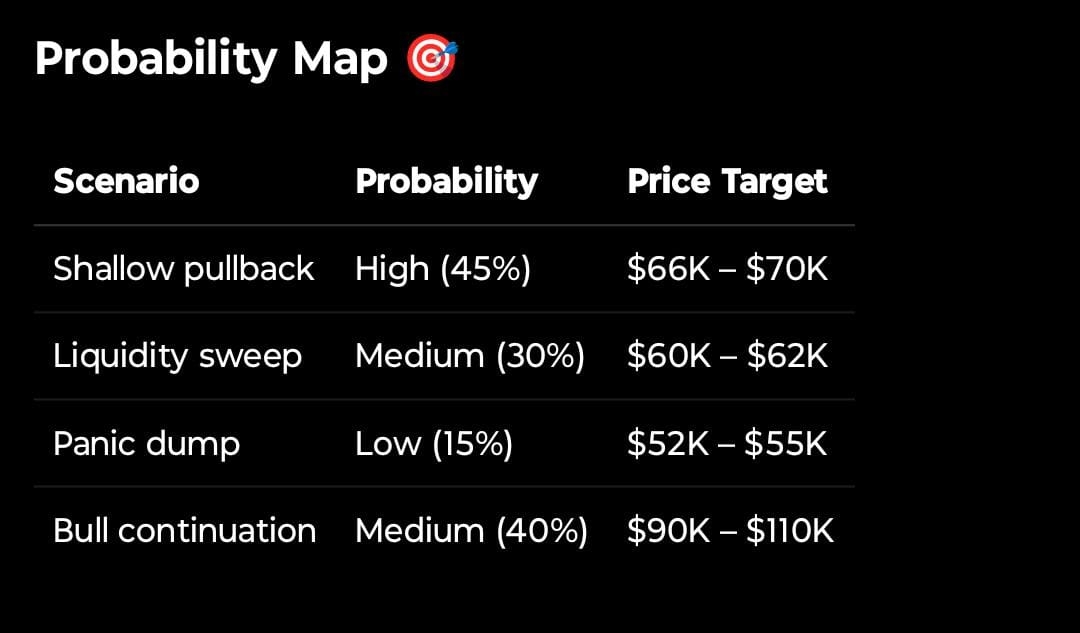
Probability Map 🎯
Final Verdict
Yes, Bitcoin can revisit $60K.
But if it does, it’s more likely to mark a high-conviction accumulation zone than a cycle top.
This structure still fits a classic bull-market correction resetting leverage, flushing weak hands, and preparing for the next impulse.
