$BTC in macro pressure phases always shows a consistent characteristic: the long-term structure is more important than any short-term narrative.
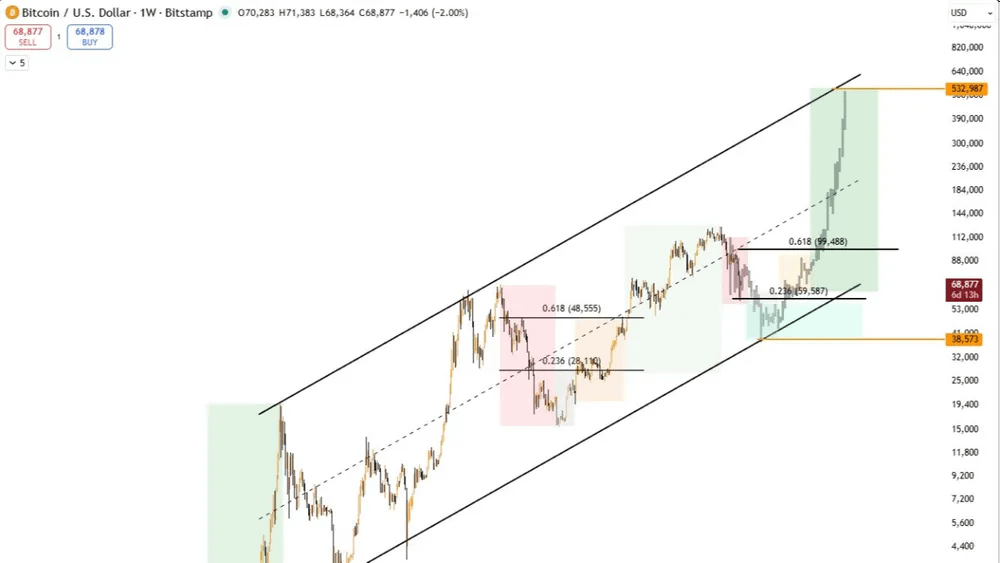
On the weekly chart, BTC is still trading within a long-term upward channel that has guided prices through many cycles. Major expansions in the past have respected this structure, while deep corrections often return to test the lower boundary of the channel.
A historically significant milestone and prominent structure in this context is the 200-week moving average (MA 200W).
The role of MA 200W
MA 200W has often acted as a cycle bottom area in Bitcoin's bear markets:
In 2018, BTC found a bottom right around this area
In 2022, the price temporarily broke through the MA 200W, causing strong psychological pressure but simultaneously forming a long-term accumulation area
Therefore, if Bitcoin loses the MA 200W again, history shows this is a structural signal that needs to be taken seriously, rather than ignored.
Convergence at the $38,000 area
The $38,000 mark is not merely a psychological number. On the chart, this area converges many important technical factors:
Approaching the lower boundary of the long-term upward channel
Coinciding with a notable Fibonacci retracement area
Near accumulation areas with high trading volume in the past
In the 2022 cycle, when BTC lost the MA 200W, the price did not collapse immediately. However, after the structure was broken, bearish momentum increased significantly. A similar structural risk still exists if this scenario repeats.
This does not mean that BTC must return to $38,000. Instead, if the MA 200W is broken, this will become a high-probability area for the market to react, rather than a rigid prediction.
The context of the current cycle
The difference in this cycle is that Bitcoin has previously set new highs in a tightening macro environment, with significant momentum coming from ETFs and institutional capital.
The market is currently facing two structural scenarios:
Bitcoin maintains the long-term channel, confirming the durability of the trend
Or the structure is broken, forcing prices to seek deeper liquidity areas before a new expansion phase can form
Clearly distinguishing between these two states is important for risk management, not just for short-term traders but also for long-term investors.
MA 200W represents the boundary between long-term belief and structural tension.
If this line is broken, $38,000 is a level that the market is likely to react to.