Looking at this long-term chart gives me chills:
Bitcoin is terrifyingly recreating the old cycle structure of 2017 and 2021!
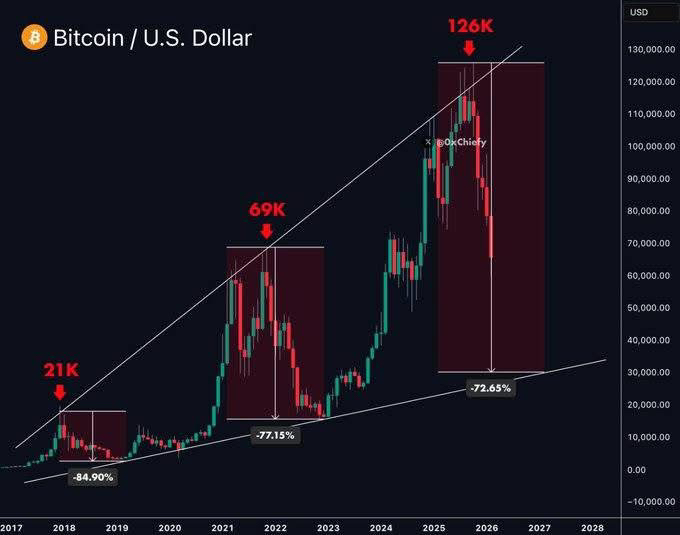
🔶 From the peak in 2017 to the bottom in 2018: down -84.9%
🔶 From the peak in 2021 to the bottom in 2022: down -77.15%
🔶 Latest peak 2025–2026: 126K → If the average correction level of ~77–80% repeats → the price could reach the range of 25K–35K before starting a new upward cycle!
Currently:
🔶 The price is currently below the long-term trend line
🔶 Has adjusted -72.65% from the peak of 126K → There is still 'room' to drop further if the bear market lasts.
🔶 This is the phase of the 'final shakeout' – eliminating weak hands, accumulating for smart money before the next bull run.
It sounds terrifying, but the history of Bitcoin cycles has always been this way: pain before the explosion.
What do you think about this scenario?
Will BTC really go back to 35K or is it just extreme FUD? Are you holding spot, DCA dip, or have you sold some from the peak?
Comment your position right away, tag your friends to discuss together! DYOR
