I have been staring at the spreadsheets all morning.
The emotion in the market is loud, but the data is whispering something very different.
We are currently sitting in a heavy correction phase.
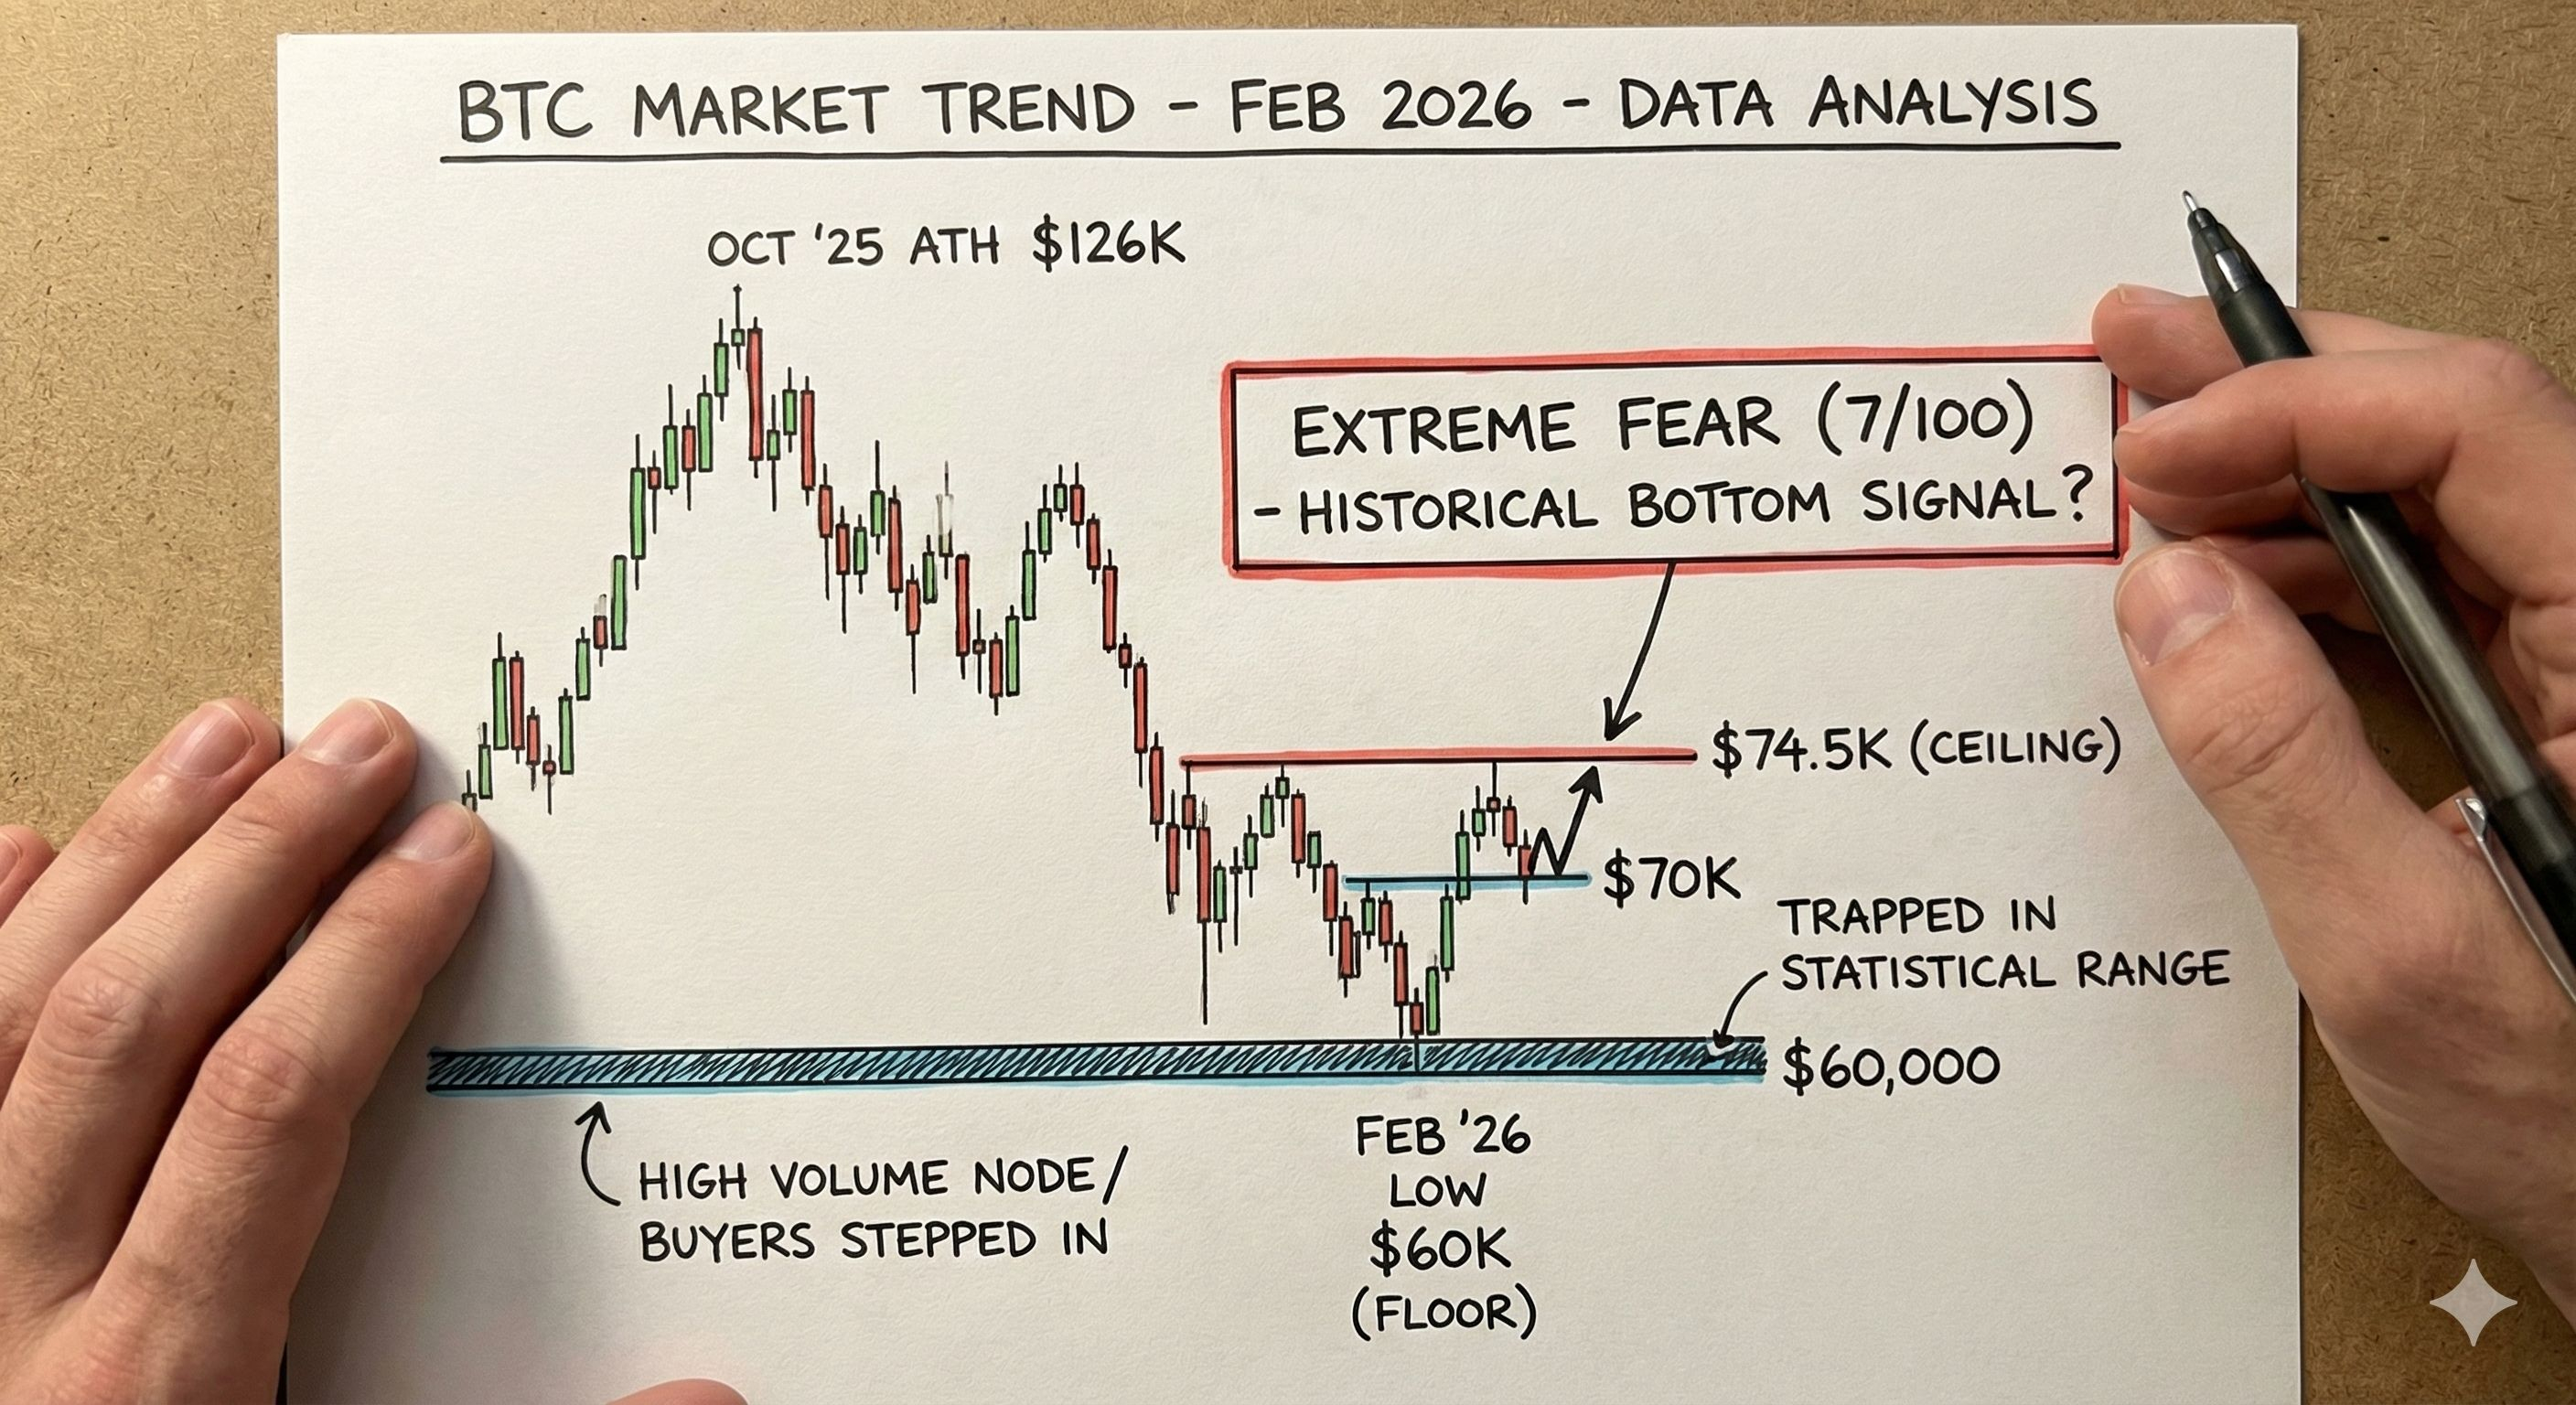
Since $BTC hits all-time high of $126,000 back in October, we have shed nearly 45% of the asset's value.
That is a painful number.
But statistically, this is where the math gets interesting.
¤ The 7/100 Signal
My volatility models are flashing red.
The Fear and Greed Index just hit 7/100. We call this "Extreme Fear." The last time the data showed sentiment this low, it wasn't a warning to sell. It was a statistical probability of a bottom.
The crowd is panic selling right when the historical data suggests the selling pressure is exhausted.
¤ The $60,000 Probability
Bitcoin tested the $60,000 level last week.
In technical analysis, it's called a "high volume node." It is a price area where a massive amount of Bitcoin previously changed hands. It acts like a concrete floor.
The data shows that buyers stepped in aggressively at this level.
As long as the daily close stays above $60,000, the bullish structure remains mathematically possible.
¤ The Invalid Point
However, I am looking at one specific number for the reversal.
$74,500.
Current liquidity heatmaps show a wall of sell orders sitting right there. Until the price breaks and closes above that number, the trend is technically bearish.
We are trapped in a statistical range between the floor at 60k and the ceiling at 74.5k.
The volume is declining. The bands are tightening.
A big move is mathematically guaranteed within 48 hours.
If the floor gives way...
I am keeping my eyes glued to the volume monitor for the next 4 hours.
If that $74,500 wall breaks, the math changes instantly.
I will drop the new targets the second we get a confirmed close.
Make sure you are following so you see it first. You do not want to be late to this move.
