Family, who understands, XPL put on a thrilling 'V-shaped reversal' performance from February 9 to 10. It dropped from a high of 0.0853 to a low of 0.0781, and then strongly rebounded to 0.0848. How many people were left in shock from this operation? Today, I will thoroughly review this market trend with you, deeply interpreting the logic behind it from a technical perspective.
1. Market Review: From Unilateral Decline to Strong Rebound
From the three candlestick charts you provided, XPL's market can be divided into three stages:
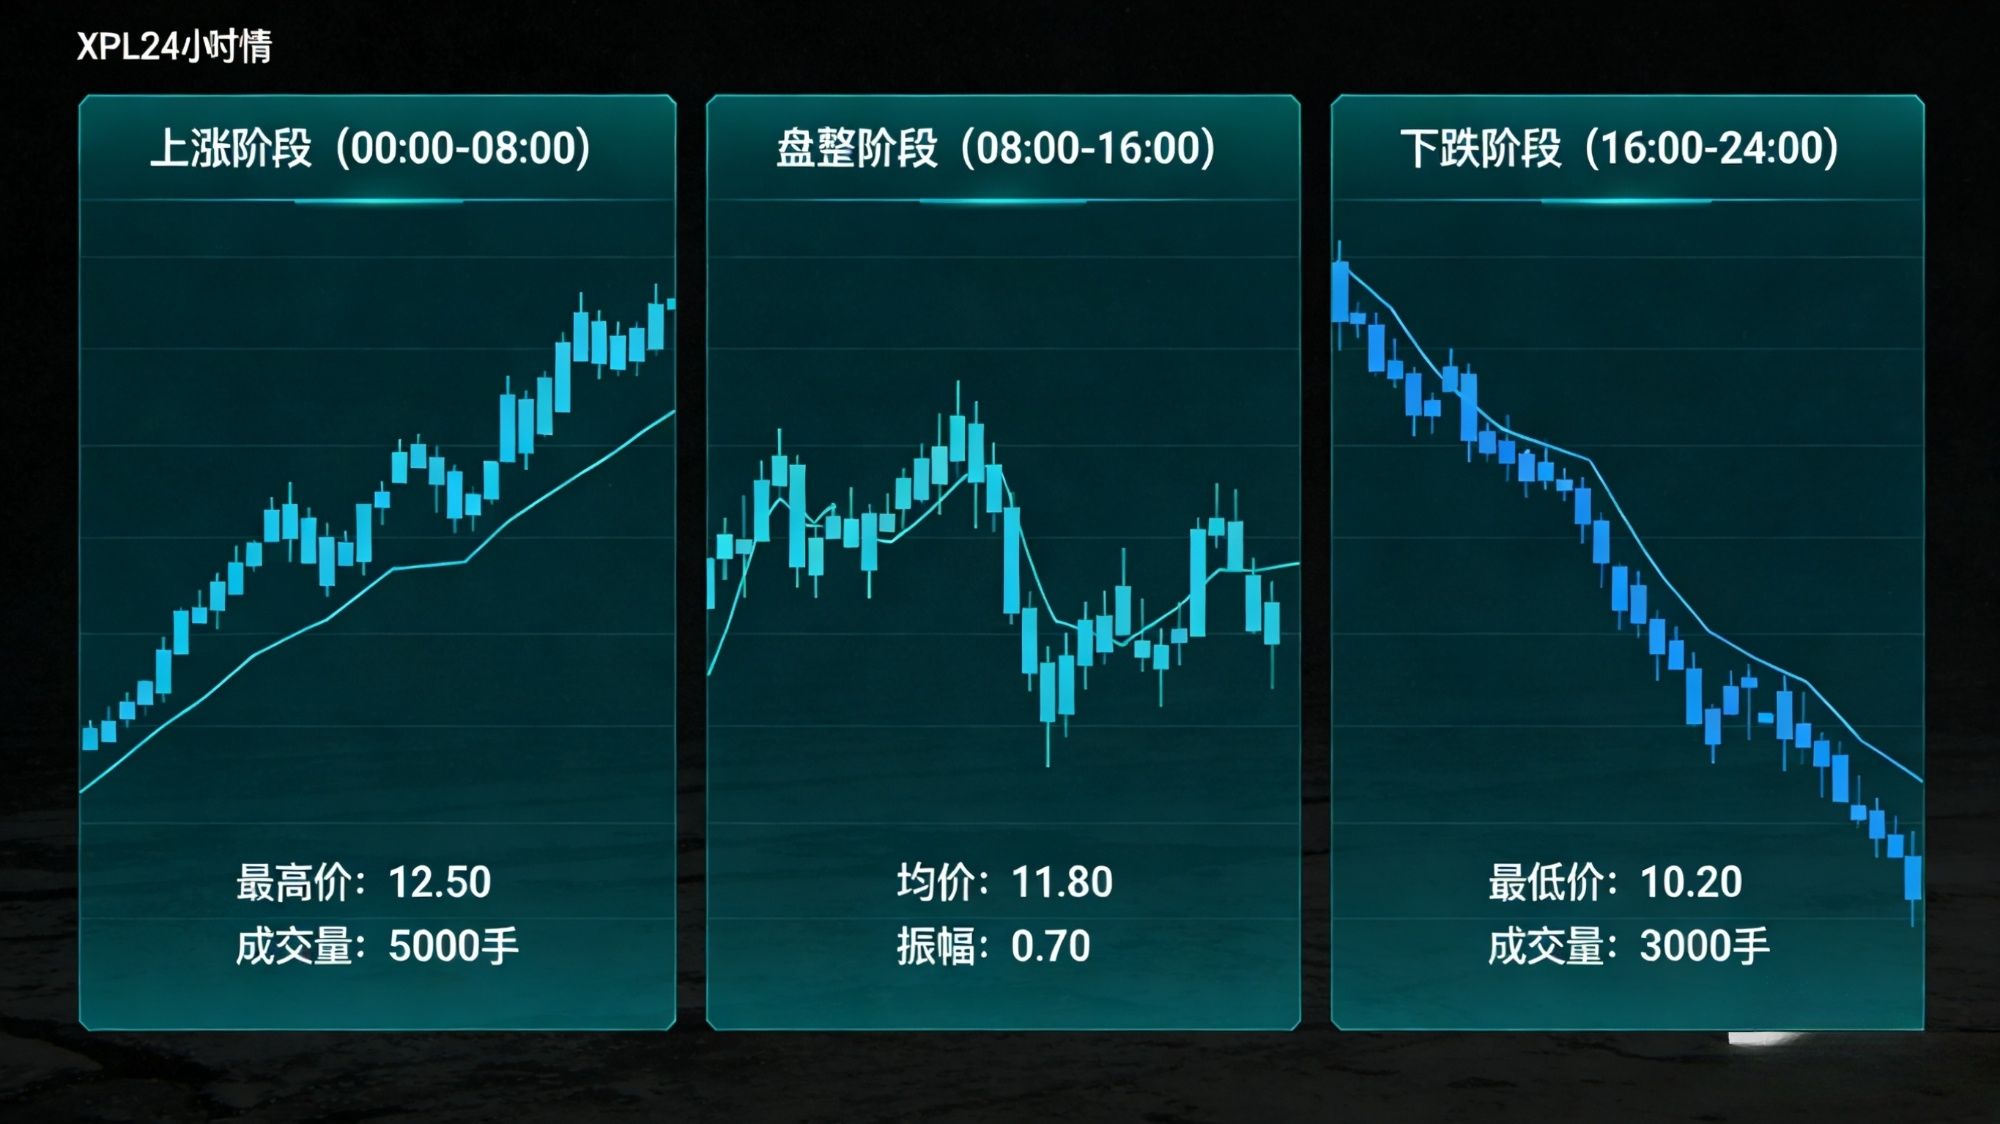
Phase One: Unilateral Decline (February 9 00:45 - February 9 18:45)
At this stage, XPL's price has dropped from 0.0853 to 0.0781, a decline of over 8%. The SUPERTREND indicator has remained in the red bearish zone, the RSI(6) indicator has dropped from around 40 to the oversold range of 18.6, and the MACD indicator has formed a dead cross, with green energy bars continuously amplifying, indicating that bearish strength is in absolute control.
Phase Two: Consolidation (February 9 18:45 - February 10 06:30)
After hitting a low of 0.0781, XPL's price began to stabilize and rebound, fluctuating between 0.08 and 0.082. The SUPERTREND indicator switched back and forth between 0.0802 and 0.0819, the RSI(6) indicator rose from 18.6 to a neutral position of 50.8, the green energy bars of the MACD indicator gradually shortened, and the DIF line began to converge towards the DEA line, indicating a gradual weakening of bearish strength and a beginning accumulation of bullish strength.
Phase Three: Strong Rebound (February 10 06:30 - Present)
After consolidating in a range, XPL's price began a strong rebound, reaching a high of 0.0848, and is currently stabilizing around 0.0839. The SUPERTREND indicator has switched to the green bullish zone, the RSI(6) indicator has risen to a neutral position of 50.8, and although the MACD indicator is still hovering near the 0 axis, the DIF line has started to converge towards the DEA line, indicating that bullish strength is dominating.
2. In-depth Technical Analysis: Bullish-Bearish Contest at Key Positions
From a technical analysis perspective, XPL is currently at a critical position for a bullish-bearish contest.
SUPERTREND Indicator: The SUPERTREND indicator switched from the red bearish zone to the green bullish zone, which is a strong reversal signal indicating that the short-term trend has shifted from bearish to bullish.
RSI(6) Indicator: The RSI(6) indicator rose from an oversold range of 14.2 to a neutral position of 50.8, indicating that market sentiment has shifted from extreme pessimism to neutrality, and bullish strength is gradually being released.
MACD Indicator: The MACD indicator is hovering near the 0 axis, with the DIF line and DEA line nearly overlapping, indicating that bullish and bearish forces are temporarily in a balanced state. If the MACD can form a golden cross and the red energy bars start to amplify, then XPL is expected to begin a new upward trend; conversely, if the MACD forms a dead cross and the green energy bars start to amplify, then XPL may undergo further adjustments.
3. Market Outlook: Short-term oscillation, long-term optimism
Regarding the future trend of XPL, I believe the short-term market may continue to be in a state of oscillation and adjustment, with prices likely fluctuating between 0.08 and 0.085, digesting previous profit-taking and trapped positions. However, from a long-term perspective, I still have a very optimistic view of XPL's development prospects.
From a technical perspective, XPL has successfully broken through the previous downtrend line, and the SUPERTREND indicator has switched back to the bullish zone, which are all positive signals. If the price can hold above 0.085, it is expected to continue challenging the previous highs of 0.09 to 0.10.
From a fundamental perspective, Plasma, as a blockchain project focused on Layer2 scaling and privacy computing, has always been recognized for its technical strength and team background. Recently, the Plasma Foundation has also been actively promoting ecological construction, reaching cooperation agreements with multiple partners, and launching a series of new products and services. These favorable fundamental news provide solid support for XPL's long-term development.
Of course, investing in cryptocurrencies always carries risks, and market volatility is significant. Therefore, I advise everyone to implement risk control when investing in XPL and not to blindly chase prices. A phased investment strategy can be adopted, increasing positions during price corrections and decreasing positions during price increases, maintaining a good mindset and discipline.
Folks, although this wave of XPL's market is exciting, it also shows us the resilience and potential of this project. As a long-term optimistic investor in Plasma, I will continue to hold and pay attention to the project's development. I believe that with the efforts of the Plasma Foundation, XPL will certainly achieve greater success in the fields of Layer2 scaling and privacy computing, bringing more innovation and breakthroughs to the entire cryptocurrency industry.
