

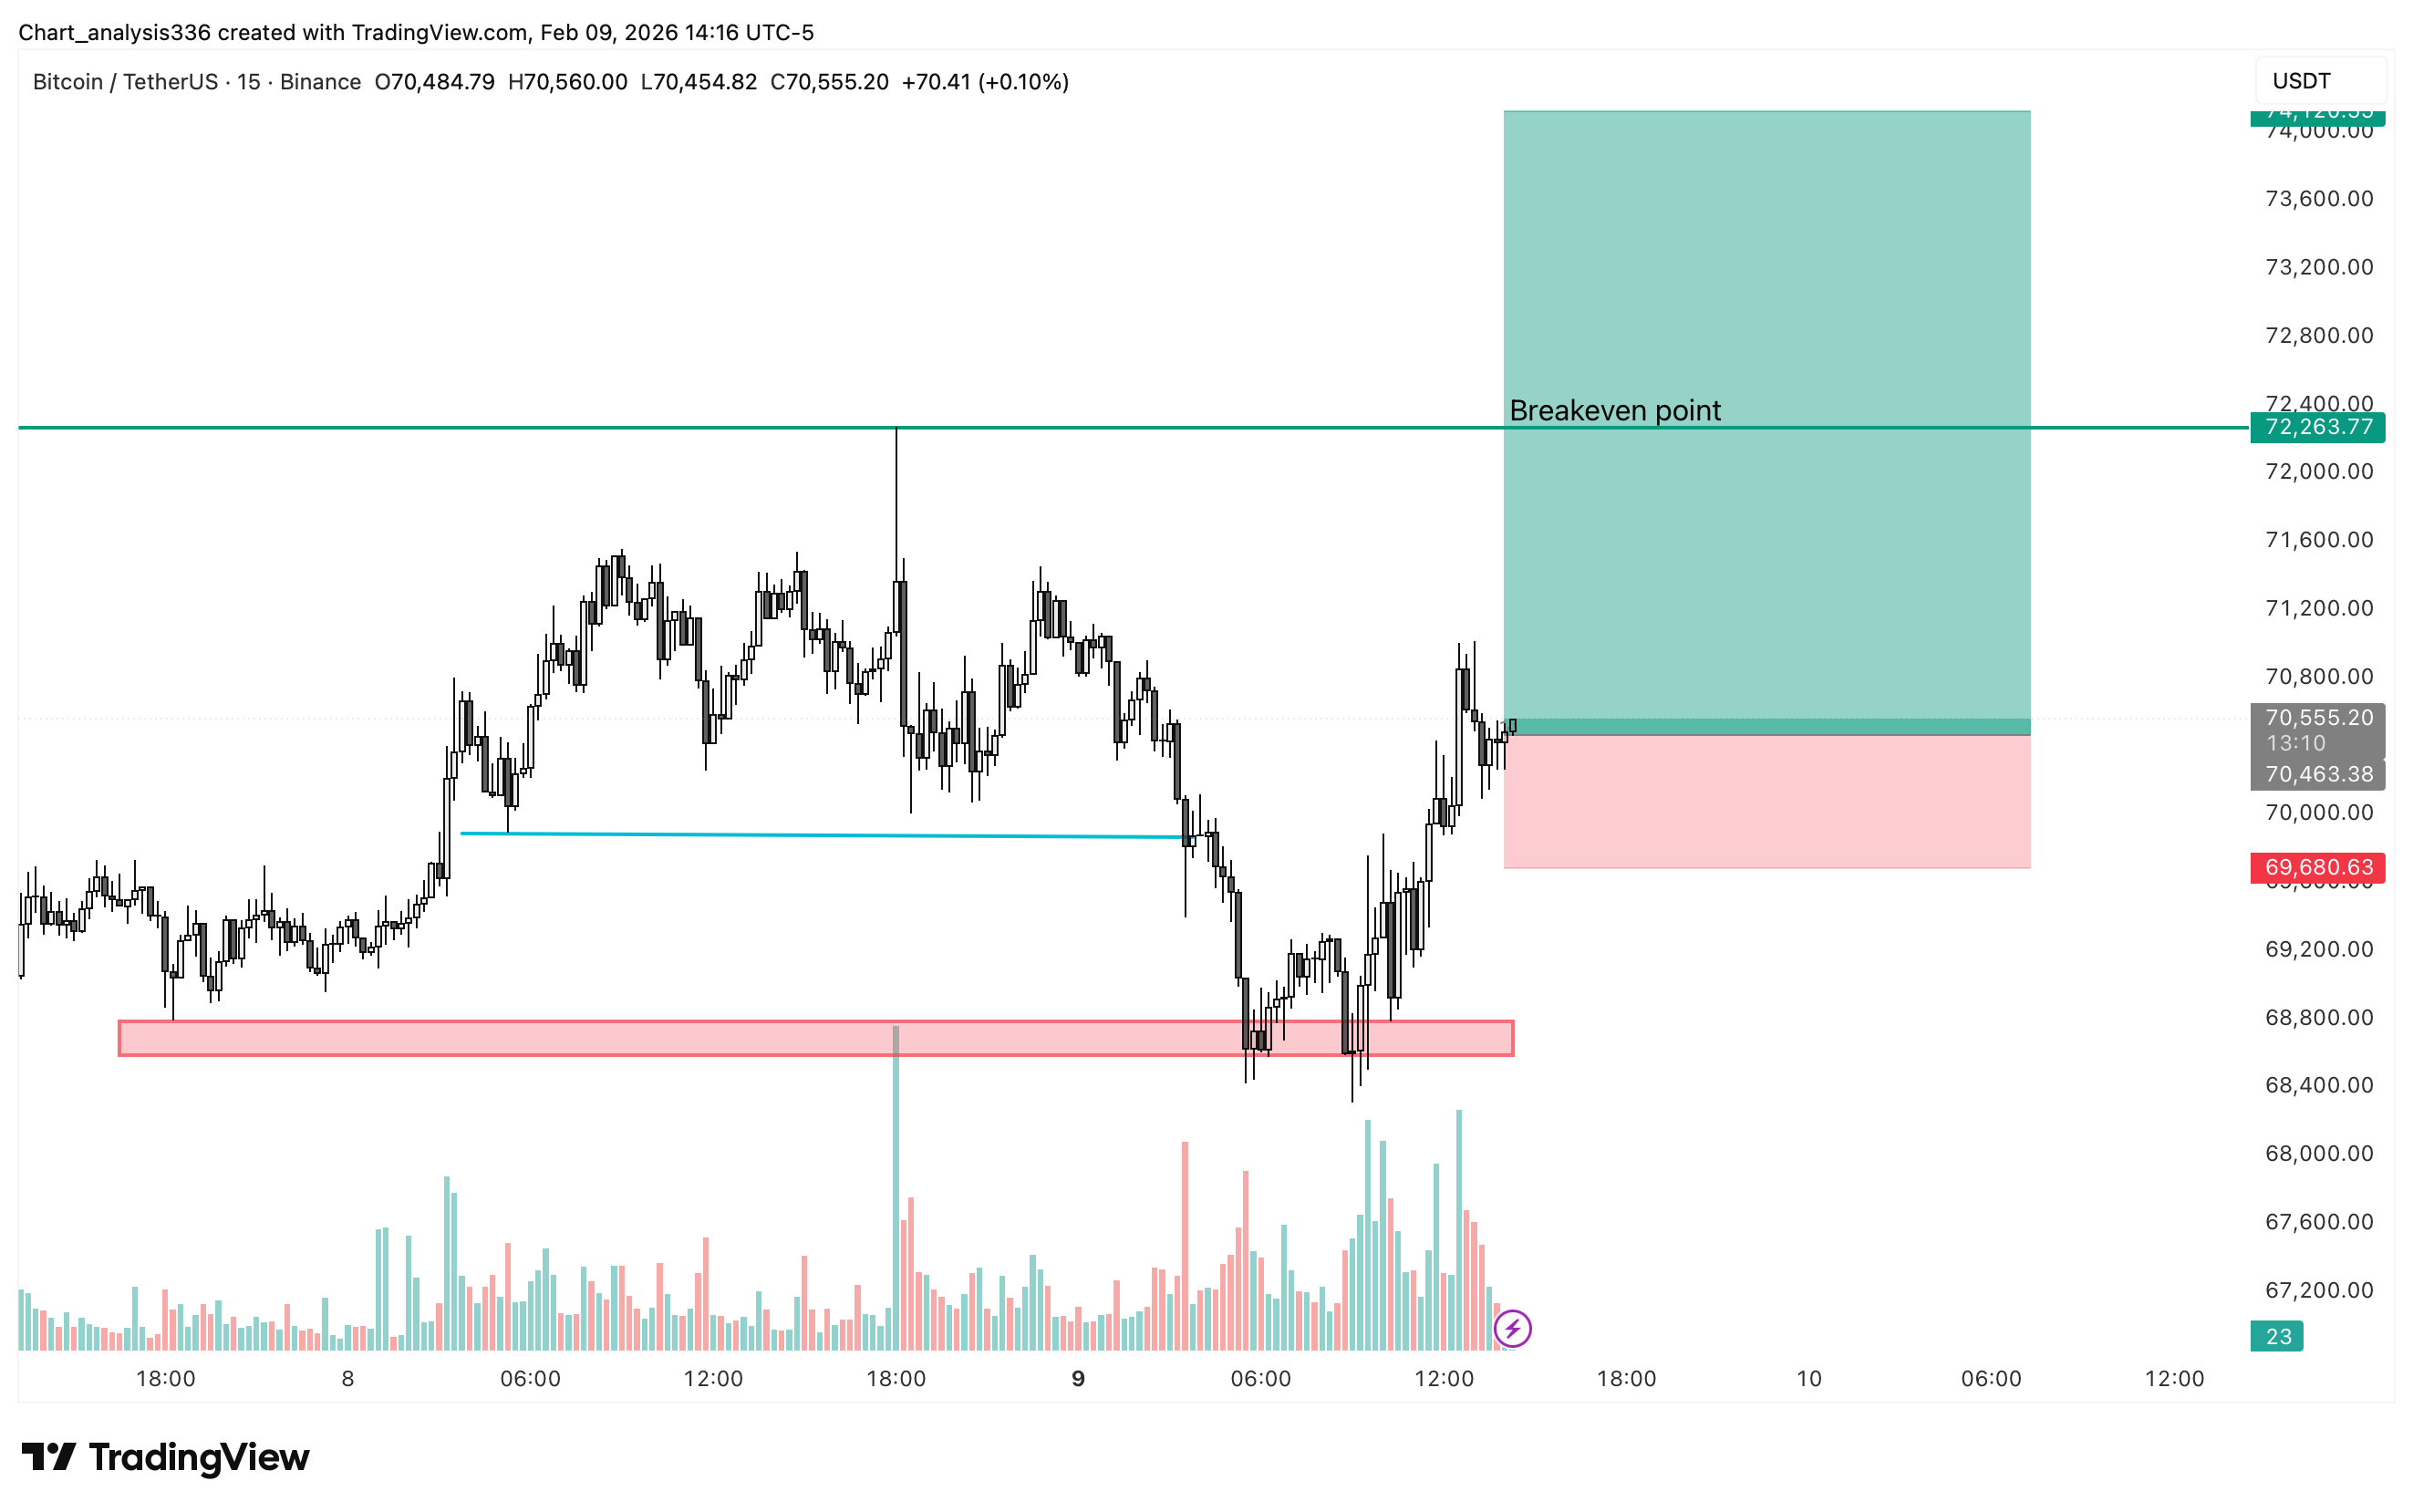
The chart which clearly show the next move of the market. $BTC move on 15min chart is given below in the image the analysis is clear just following the trend and key points are clearly mentioned.
Bitcoin is currently showing a short-term recovery structure on the 15-minute timeframe after a strong rejection from lower support. The price previously dropped into a well-defined demand zone near the 68,600–68,900 region, where buyers stepped in aggressively. This area acted as a liquidity sweep and accumulation zone, leading to a sharp bounce. The strong bullish reaction from this level indicates that institutional and large-volume participants are defending this zone, making it a key foundation for the current upward move.

After reclaiming the broken intraday support, price formed a sequence of higher lows and higher highs, confirming a short-term trend reversal. The impulsive bullish candle that pushed Bitcoin above 70,000 shows renewed buying pressure and growing confidence among traders. Volume expansion during this recovery further supports the idea that this move is backed by real demand rather than weak speculative buying. This shift in momentum suggests that the market is transitioning from a corrective phase into a potential continuation phase.
The current consolidation near the 70,400–70,600 region represents a healthy pause after the impulse move. This area is acting as a minor support and also aligns with the entry zone shown in the setup. Holding above this region is critical for maintaining bullish structure. As long as price remains above this base, buyers are in control, and the probability of continuation toward higher resistance increases.
The breakeven level around 72,260 is an important technical reference. This zone represents previous rejection and supply, where sellers previously entered the market. A successful break and hold above this level would confirm strength and invalidate short-term bearish pressure. If price reaches this area with strong momentum and volume, it is likely to trigger further buying from breakout traders and stop-loss orders from short sellers, potentially accelerating the move toward higher targets.
The projected upside target near 74,200 is aligned with the next major resistance and liquidity pool. This level corresponds with previous highs and untested supply, making it a natural magnet for price. If momentum remains intact, this zone is a realistic objective for the current bullish structure. However, partial profit-taking is recommended before this level, as strong reactions are likely in this area.
On the downside, the stop-loss zone around 69,600–69,700 is placed below the recent higher low and below the consolidation base. A break below this region would invalidate the bullish structure and indicate that buyers have lost control. Such a move would likely lead to a retest of the lower demand zone near 68,800. Therefore, maintaining price above this level is essential for this setup to remain valid.
From a market psychology perspective, the recent rejection from support followed by a strong recovery reflects a classic shakeout pattern. Weak longs were flushed out near the lows, while strong hands accumulated positions. This behavior often precedes continuation moves, especially when accompanied by rising volume and structural confirmation. The current market environment favors disciplined long positions rather than chasing breakouts blindly.
Risk management remains crucial in this setup. Although the structure is bullish, intraday volatility can still cause temporary pullbacks. Traders should avoid overleveraging and respect the predefined stop-loss. Scaling out profits near resistance zones and moving stop-loss to breakeven after confirmation near 72,200 can help protect capital and lock in gains.
Trade Setup
Entry Zone: 70,400 – 70,600
Target 1: 71,500
Target 2: 72,260 (Breakeven Zone)
Target 3: 74,200
Stop Loss: 69,600
This setup is based on demand zone defense, bullish structure shift, and momentum continuation. As long as price holds above the entry base and respects higher lows, the bias remains bullish. A confirmed breakout above 72,260 will significantly increase the probability of reaching the higher target zone.
#BTC #BitcoinGoogleSearchesSurge