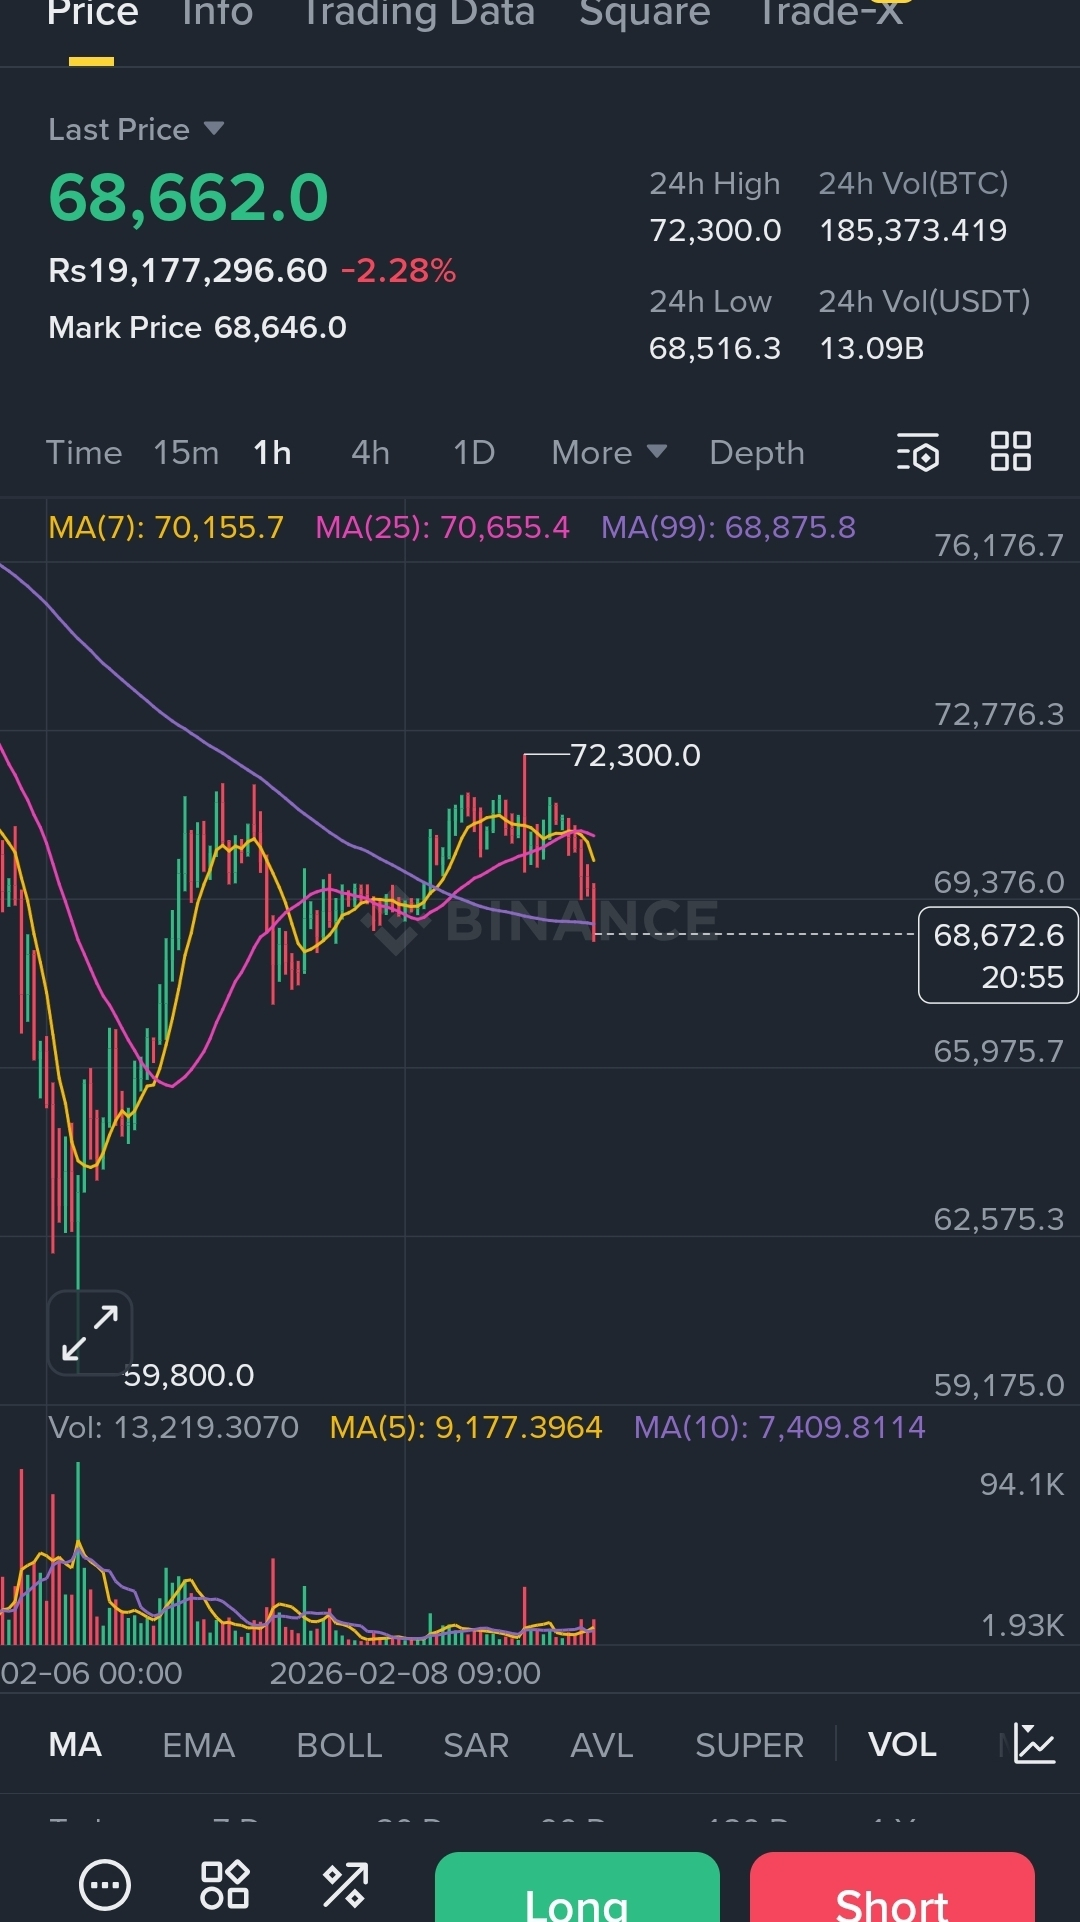
 The chart you shared shows a live snapshot of $BTC perpetual futures with moving averages, volume, and short-term price structure. Even without knowing what happens next, this single screen contains many lessons about how real trading works: uncertainty, momentum, structure, and — most importantly — discipline. A good trader doesn’t just see candles moving; they read behavior, context, and probability.
First, notice how price reacts around moving averages. These lines are not magic predictors — they are visual summaries of recent price behavior. When price trades below key averages, it suggests short-term weakness or hesitation. When it climbs above them, momentum may be improving. But the key word is may. Markets are dynamic, and averages lag behind price. Smart traders use them as context, not absolute signals. The chart shows a recent push upward followed by a pullback, which is a reminder that markets breathe — expansion and correction are natural cycles.
Second, volume tells a story about participation. Spikes in volume often indicate strong interest or emotional reactions. When price moves with rising volume, conviction may be stronger. When price drifts with declining volume, momentum can fade. On your chart, bursts of activity appear around turning points. This teaches a core principle: movement matters less than who is participating. Trading is not just about direction — it’s about energy behind that direction.
Another important lesson here is structure. Markets rarely move in straight lines. Instead, they form swings — highs, lows, consolidations. These structures reveal where buyers and sellers previously fought for control. A trader observing this chart might notice how price approaches prior levels and reacts. This is not prediction; it’s pattern awareness. Understanding structure helps traders avoid emotional decisions driven by fear or excitement.
Equally critical is risk awareness. Futures charts can look exciting because price moves quickly, but speed increases emotional pressure. Many beginners focus only on potential gains and ignore the importance of managing uncertainty. Every chart — including this one — is a reminder that no setup is guaranteed. Professional thinking centers on protecting capital, staying consistent, and accepting that losses are part of the learning process.
Psychology is the invisible layer behind every candle. Rapid drops can trigger panic; fast rallies can trigger impulsive decisions. A disciplined trader learns to pause, analyze, and act based on a plan rather than emotion. The fluctuating candles on this $BTC chart represent thousands of emotional decisions happening in real time. Your edge is not predicting perfectly — it’s responding calmly.
Finally, this chart highlights patience. Not every moment is a trading opportunity. Sometimes the best decision is observation. Waiting for clarity, confirmation, or alignment with your strategy is a skill that separates reactive trading from intentional trading.
In summary, this $BTC snapshot is more than price data — it’s a lesson in market behavior. Moving averages show context, volume reveals participation, structure guides interpretation, and psychology shapes decisions. Successful trading is not about chasing every move; it’s about developing awareness, discipline, and consistency. The chart reminds us that markets are always speaking — the real skill is learning how to listen thoughtfully.
