Following a rebound last Friday that nearly erased the brutal decline from midweek, Goldman Sachs' trading department pointed out that the US stock market will face more selling from trend-following algorithm funds this week.
The S&P 500 index has fallen below the short-term key level that triggered commodity trading advisors (CTAs) to sell stocks. Goldman Sachs expects that these systematic strategies, which follow market trends rather than fundamental factors, will maintain a net selling position over the next week, regardless of market direction.
According to Goldman Sachs data, a new round of declines could trigger about $33 billion in selling this week. If pressure persists and the S&P 500 index falls below 6707 points, it could lead to an additional systematic sell-off of up to $80 billion over the next month. In a sideways market, CTAs are expected to sell about $15.4 billion in US stocks this week; even if the stock market rises, these funds may also reduce their holdings by about $8.7 billion.
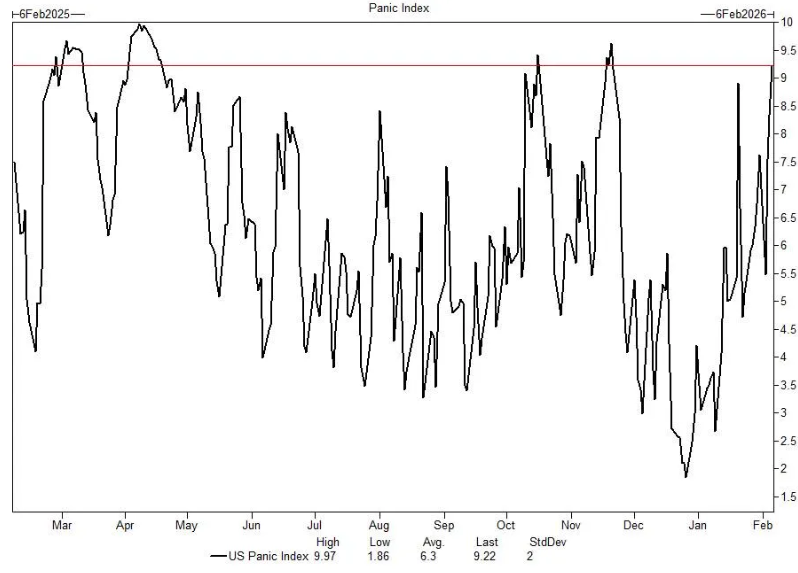
Investor anxiety surged last week. The panic index compiled by Goldman Sachs (which combines the one-month implied volatility of the S&P 500 index, the VIX volatility index, the skew of one-month put/call options, and the slope of the S&P volatility term structure) recorded a latest reading of 9.22, indicating that the market was not far from an 'extreme fear' state last Thursday.
The S&P 500 index soared 2% last Friday, ending a tumultuous week with the largest single-day gain since May of last year. This rebound came after a sharp drop triggered by the release of a new AI automation tool by Anthropic PBC early in the week. The launch caused hundreds of billions of dollars in market value to evaporate from software, financial services, and asset management stocks as investors reassessed the risks of technological disruption.
The position status of systematic strategies was the most frequently asked question by Goldman Sachs clients last Friday, highlighting a strong demand in the market for views on capital flows.
Aside from the selling by CTAs, thin liquidity and 'negative gamma' positions will keep the market choppy, potentially amplifying volatility in either direction as traders buy on the way up and sell on the way down to balance their positions.
The optimal liquidity of the S&P 500 index—i.e., the volume of buy and sell orders available at the best bid and ask prices—has sharply deteriorated, dropping from an average of nearly $13.7 million year-to-date to about $4.1 million.
"Risks cannot be quickly transferred, leading to more volatile intraday movements and delaying the stabilization of overall price trends," wrote the Goldman trading team, including Gail Hafif and Lee Coppersmith, in a report to clients last Friday.
The positions of options market makers have also reversed, potentially exacerbating market volatility. After being in the so-called 'positive gamma' zone (which previously helped prevent the S&P 500 index from breaking through 7000 points), it is estimated that market makers have shifted to neutral to 'negative gamma' positions. This dynamic becomes more pronounced when liquidity is scarce.
"Buckle up," traders added.
Other groups of systematic strategies still have significant room to reduce risk. Looking back over the past year, the positions of risk parity strategies were in the 81st percentile, while volatility control strategies were in the 71st percentile. Unlike CTAs, these funds react to the ongoing changes in the actual volatility of the S&P 500 index, which means that if volatility remains high, its impact will be more pronounced. The actual volatility of the S&P 500 index is rising, but the 20-day volatility indicator is still below the levels of November and December of last year.
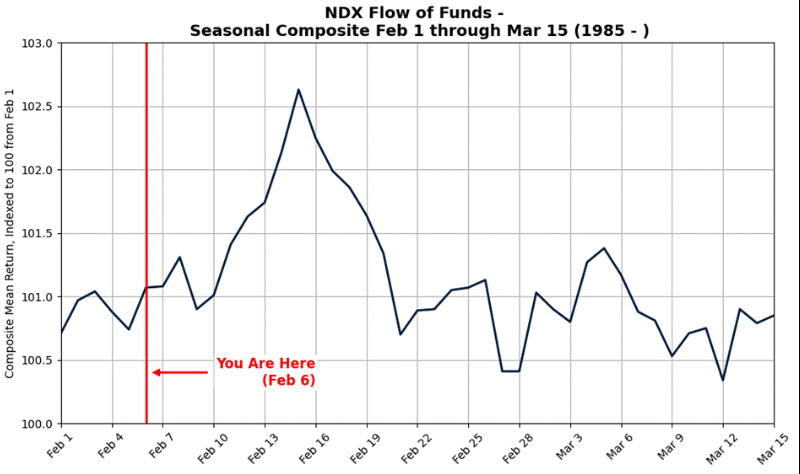
Seasonal factors also struggle to provide a breather. Historically, February tends to be a weaker and more volatile month for the S&P 500 and Nasdaq 100 indices as the supportive capital flows in January, including pension funds entering the market and the peak of retail activity, dissipate.
Retail behavior also shows signs of fatigue. After a year of relentless buying on dips, the latest two-day net fund flows from retail investors indicate a net sell of about $690 million last week, showing a weakening willingness to 'buy the dip'. Some popular retail trading targets have been hit particularly hard, increasing the risk: once a broader rotation of funds from U.S. stocks occurs, it will mark a significant deviation from last year's trading patterns.
#黄金白银反弹 #全球科技股抛售冲击风险资产 #沃什美联储政策前瞻
For those who don't know how to time the market, you can find Brother Hui, who will analyze in real-time for 25 hours a day and provide the best entry points. Daily updates of first-hand information and in-depth analysis.