5-Minute Candle Chart Analysis: A Practical Guide for Traders
Trading short-term price movements requires speed, precision, and understanding candlestick behavior. The 5-minute candle chart is popular among day traders and scalpers because it captures intraday market fluctuations without the noise of tick charts. Each candle represents price action over a 5-minute interval, showing the open, high, low, and close (OHLC).
Step 1: Identify Trend Direction
Before entering a trade, observe the overall trend on higher timeframes (like 1-hour or 15-minute charts). This prevents trading against the market. On a 5-minute chart, look for a series of higher highs and higher lows for an uptrend, or lower highs and lower lows for a downtrend. Moving averages (MA) like the 20-period or 50-period MA can help confirm trend direction.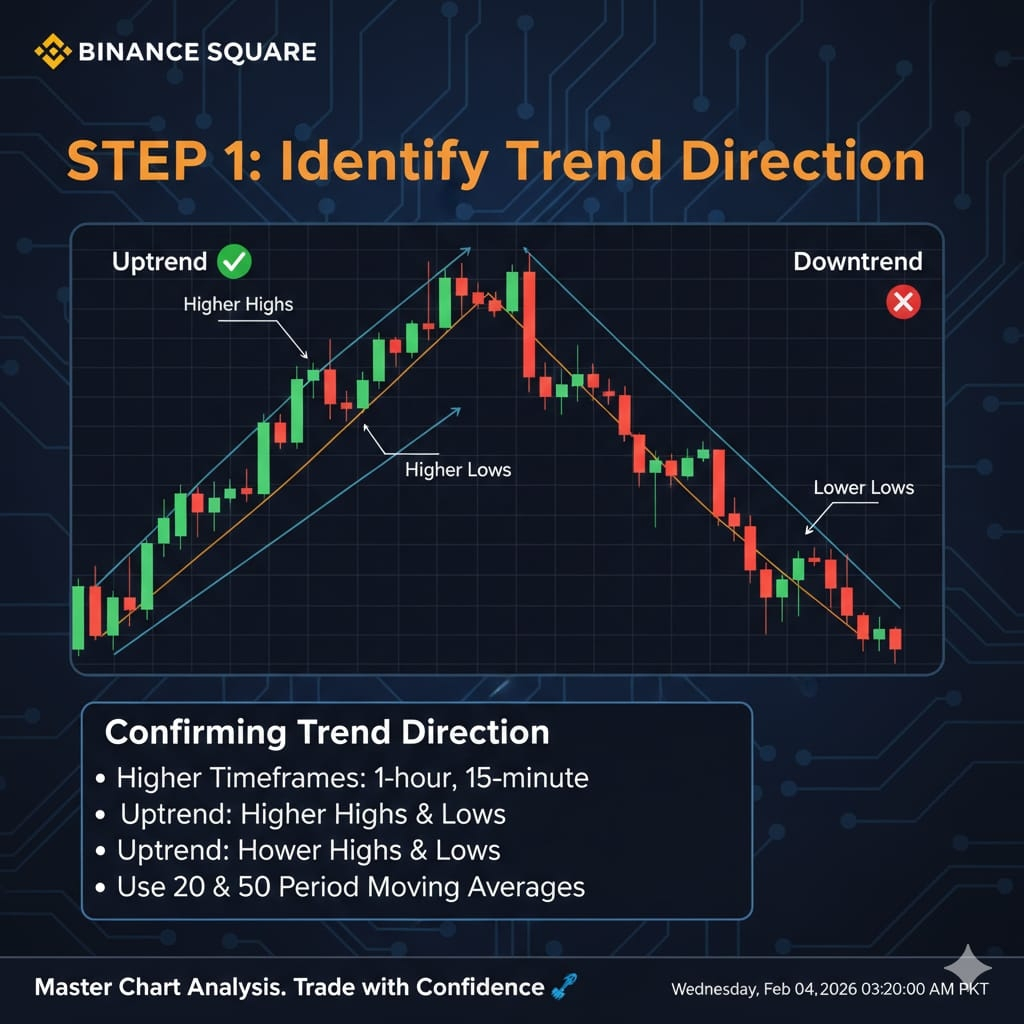
Step 2: Recognize Candlestick Patterns
Short-term charts show frequent candlestick patterns. Common ones include:
Doji: Market indecision, potential reversal.
Engulfing Candles: Strong momentum in one direction; bullish engulfing signals a possible uptrend, bearish engulfing signals downtrend.
Hammer & Shooting Star: Indicate potential reversals at support or resistance zones.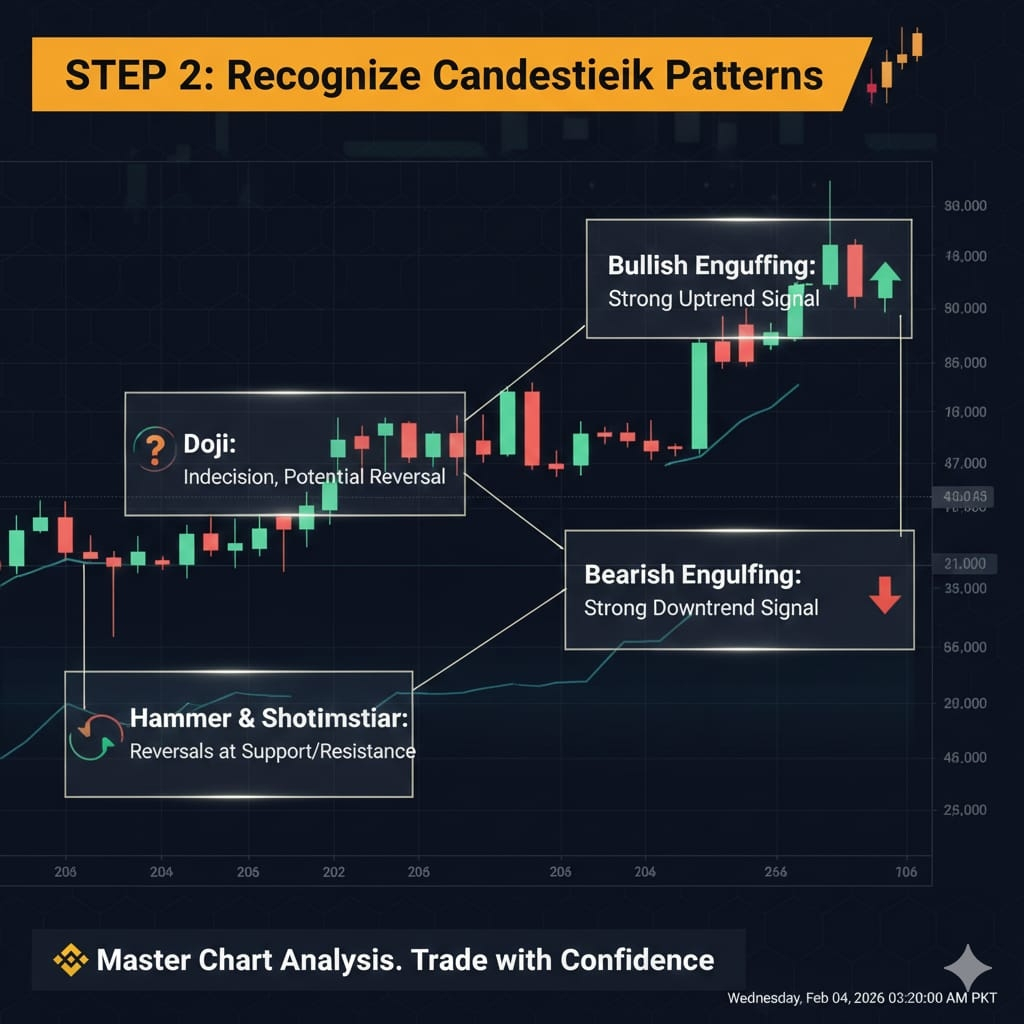
Step 3: Support & Resistance Levels
Even in 5-minute charts, support and resistance zones play a critical role. Identify previous swing highs and lows, pivot points, or round numbers. Price often reacts to these areas with bounces or breakouts, which provide high-probability trade setups.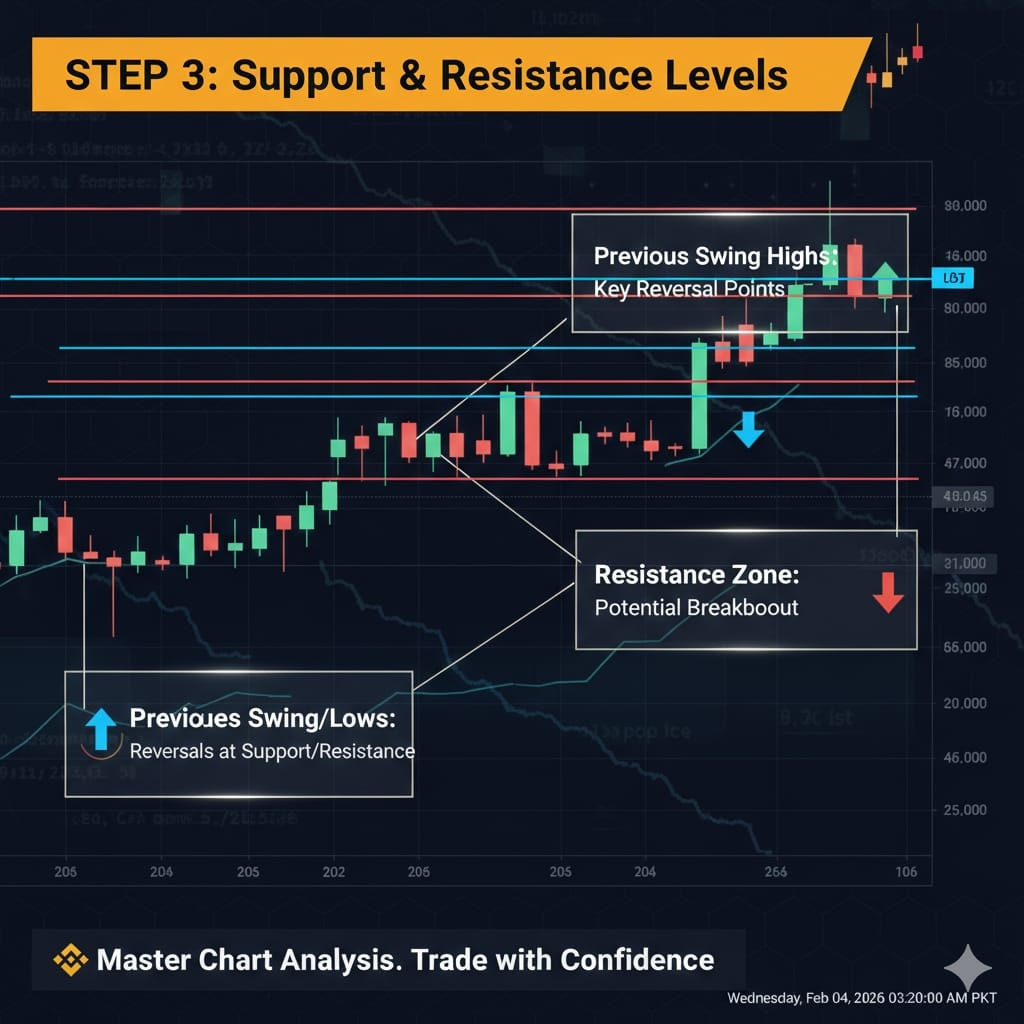
Step 4: Volume & Momentum Confirmation
Volume adds confirmation to price moves. A breakout accompanied by strong volume is more reliable than one with low volume. Indicators like RSI (Relative Strength Index) or MACD can help spot overbought/oversold conditions and potential momentum shifts.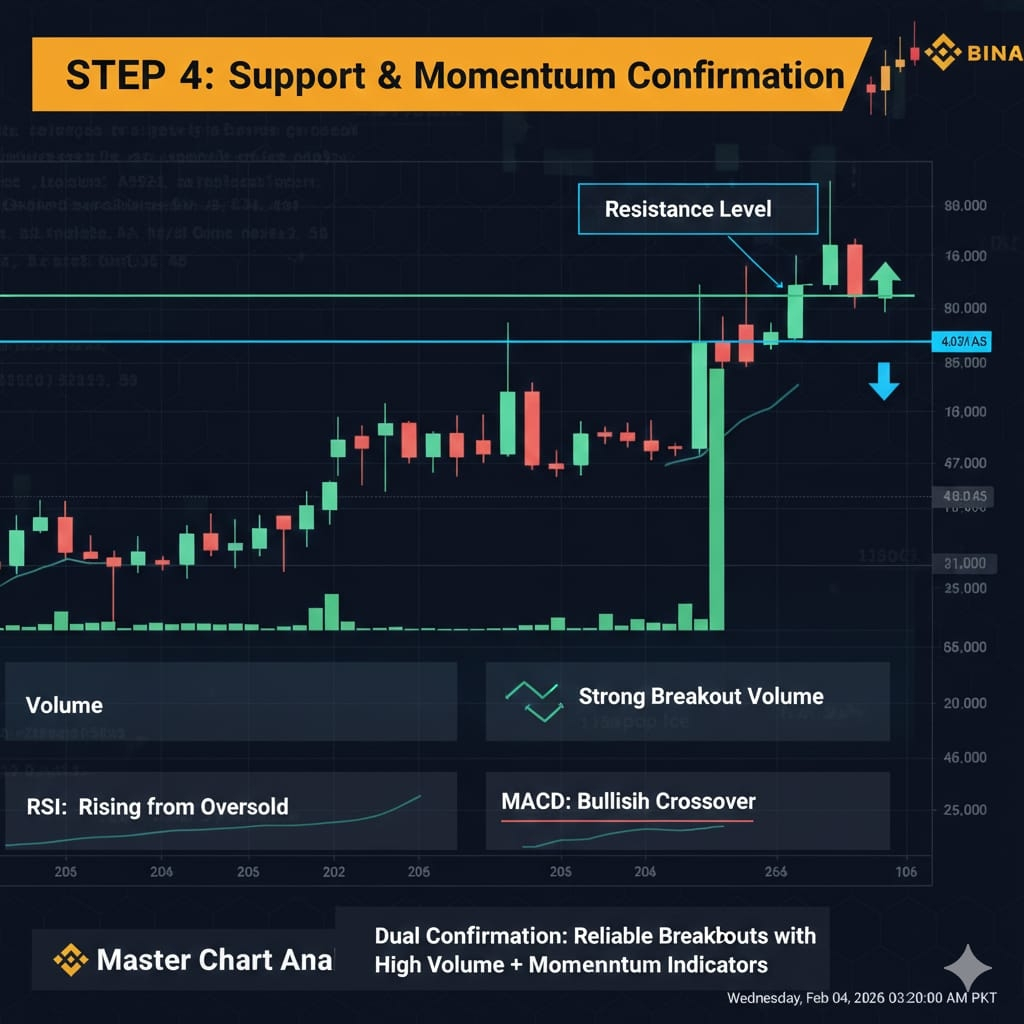
Step 5: Entry, Stop-Loss, and Exit
For scalping or intraday trades, define your entry point near support in an uptrend or resistance in a downtrend. Stop-loss should be tight, just beyond recent swing highs/lows to manage risk. Take profits in incremental targets, or use trailing stops to maximize gains during strong moves.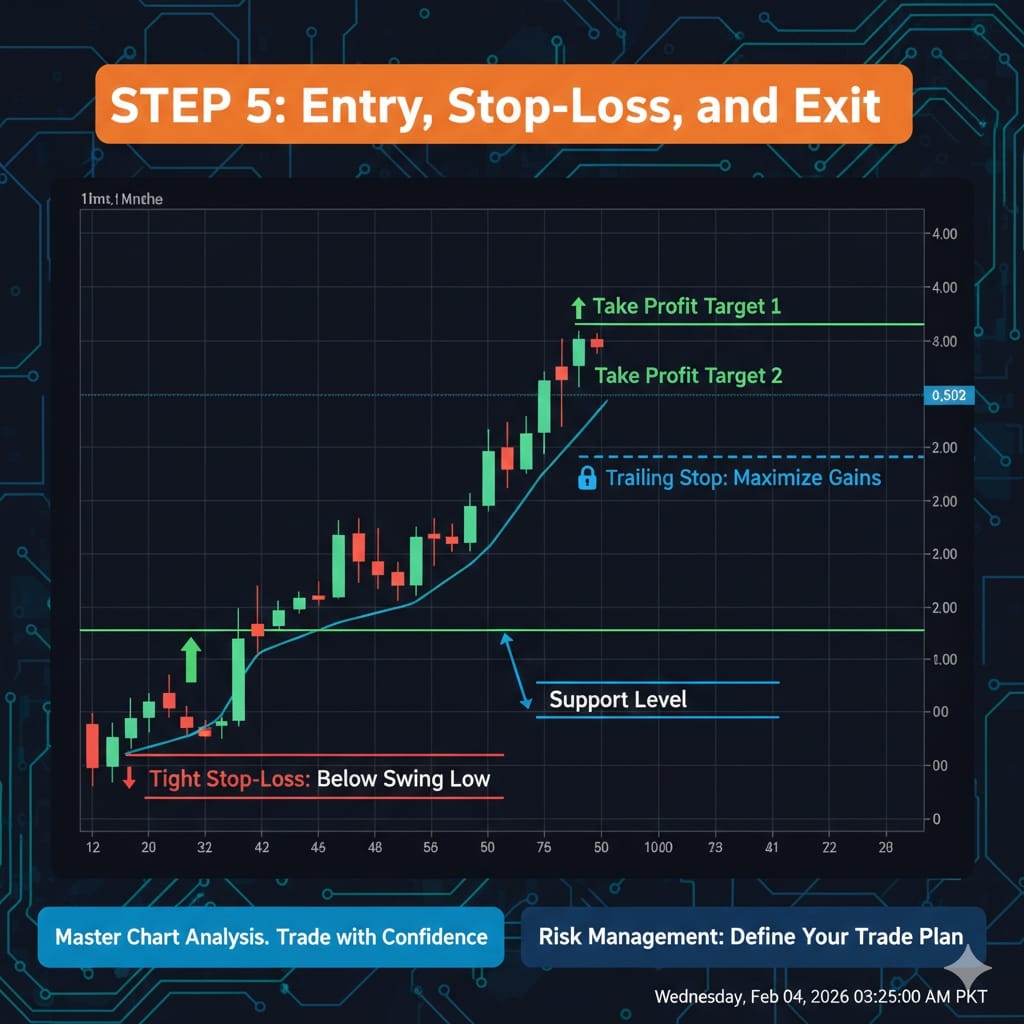
Trading Tips for 5-Minute Charts:
Avoid trading during low liquidity periods; volatility is limited.
Stick to a few currency pairs or assets to monitor efficiently.
Don’t chase the market—wait for confirmation of setups.
Keep risk-to-reward ratio at least 1:2 for consistency.
Review past trades regularly to refine strategy.
Conclusion
Mastering 5-minute candle charts requires practice, discipline, and keen observation. By combining trend analysis, candlestick patterns, support/resistance levels, and volume confirmation, traders can make informed intraday decisions and minimize risk while maximizing potential profits.#TradingCommunity #bignnersguide #MarketRally #Write2Earn $LA $ACA $XRP


