Choice is greater than effort, the circle determines fate
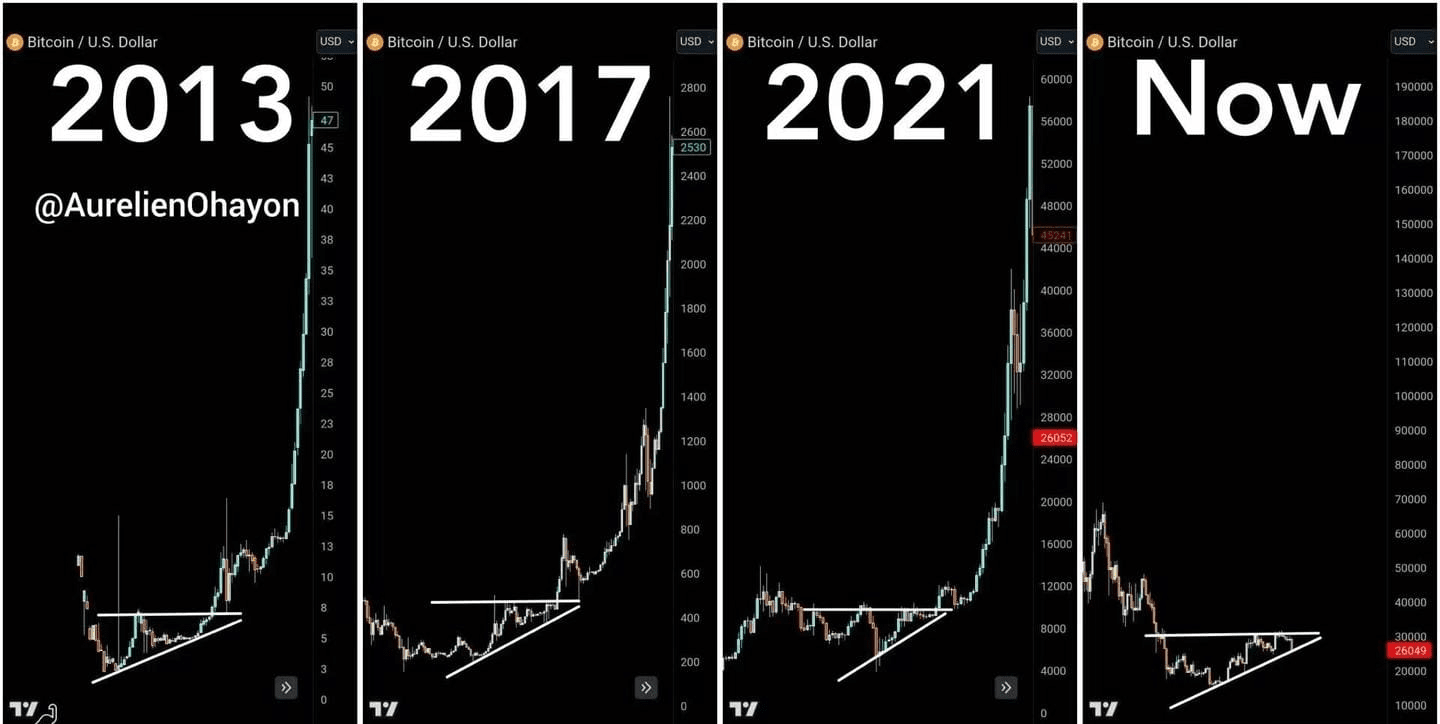
This chart has recently become popular
I see many groups are forwarding this
At first glance, there is indeed some truth to it
According to the past 3 bull markets, there is nothing wrong with the other party
However, upon closer inspection, according to this chart, it means: the big bull market has already started!
The bottom range in the chart is a triangle, and the bottoms of the 3 bull markets are the same, will the next wave be the same?
To find the answer, I also looked at the price trends from 2013 to 2023
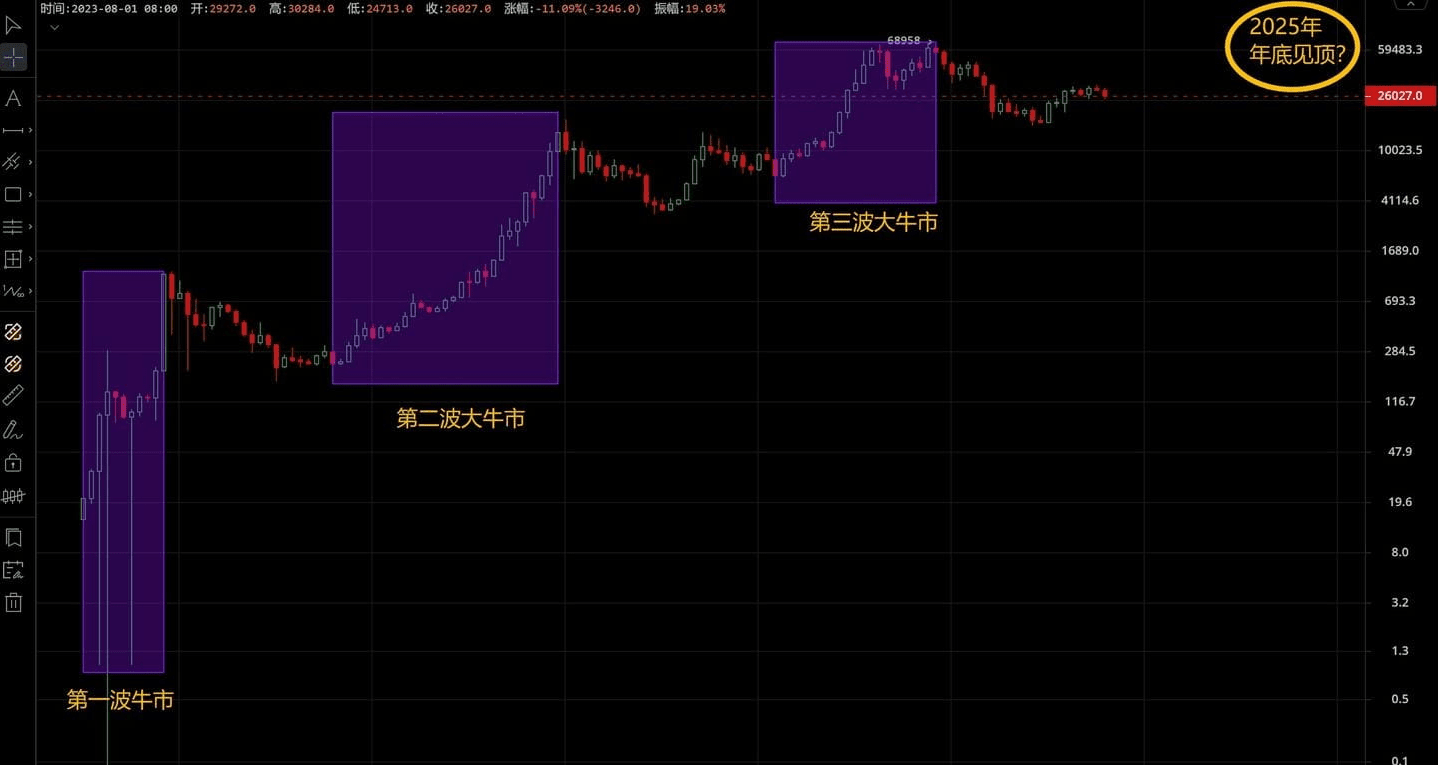
The first bull market peaked from January to December 2013 (lasting one year)
The second bull market was from August 2015 to December 2017 (lasting 2 years and 4 months)
The third wave is from March 2020 to November 2021 (1 year and 8 months)
Based on the above data, we can continue to analyze and derive more information
Because the halving time of BTC has a clear cycle, the 3 bull markets are also driven by the halving
Based on the historical market trends of the three major bull markets, we can deduce the peaks of these three bull markets and how much time is between them
From this data, we can predict:
Estimated time for the next bull market to peak!
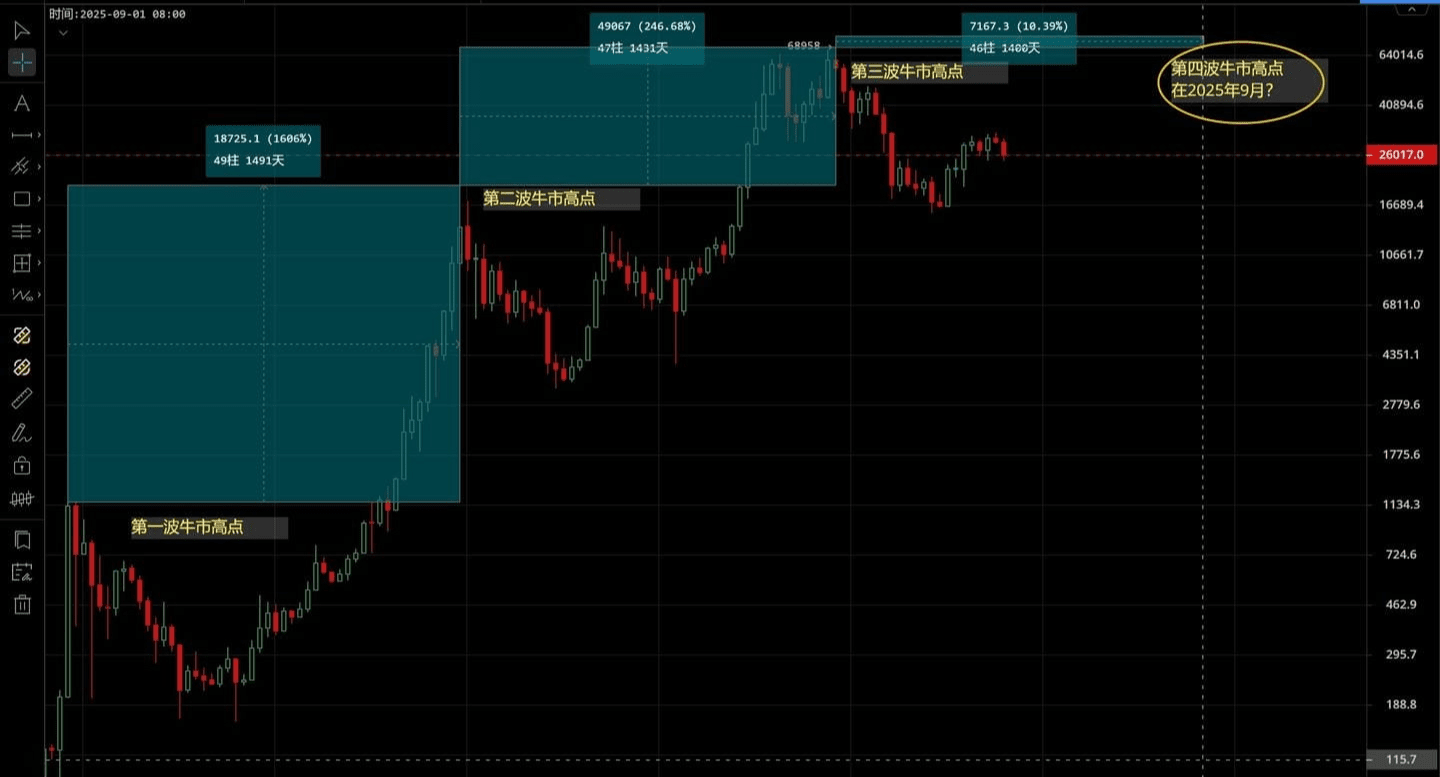
The above chart is a comparison based on market trends, using time, price, and space
The peak of the first bull market in 2013: $1,175
The peak of the second bull market in 2017: $19,891
The peak of the third bull market in 2021: $68,958
The first bull market was 1,491 days away from the second bull market, with a price difference of 16 times
The second bull market was 1,431 days away from the third bull market, with a price difference of 2.46 times
From the time and space comparison of the previous 3 bull markets, the time difference between each peak is around 1,400 days
The price difference is narrowing because the cost of BTC mining machines is increasing, the output is decreasing, and the market value is constantly growing
So the increase in each wave is normal as it decreases
It's hard to say the specific peak of the next bull market, the probability of the increase being more than the previous wave is very low
The peak of the second wave was $19,891, compared to the third wave peak of $68,958, the difference is: 246%
Being conservative, halving at 246%
The price is between: $137,916 and $153,776
Combining the time, space, and price comparisons of the past three bull markets for a comprehensive analysis
The estimated peak price of the fourth bull market is around $137,916 - $153,776
The estimated peak time for the fourth bull market is around September 2025
The above analysis only represents personal views and does not constitute any investment advice
Because there is a bull market every 4 years, everyone is eagerly anticipating, and each person's funds, technology, and perspectives are different
So to grasp this major trend, more preparation is needed
If you find the article helpful and it resolves some of your doubts
You can move your little hand: like, follow, and share
For friends in the cryptocurrency space who do not want to ride the 'roller coaster'
Continue to pay attention$ETH $XRP $BTC
#币安HODLer空投PROVE #香港稳定币新规 #下一任美联储主席人选
