SOL/USDT – Daily Analysis for Traders (1D Chart) 📊
Pair: SOL/USDT
Timeframe: 1 Day (1D)
Market Trend: Bullish Structure 📈
Market Overview:
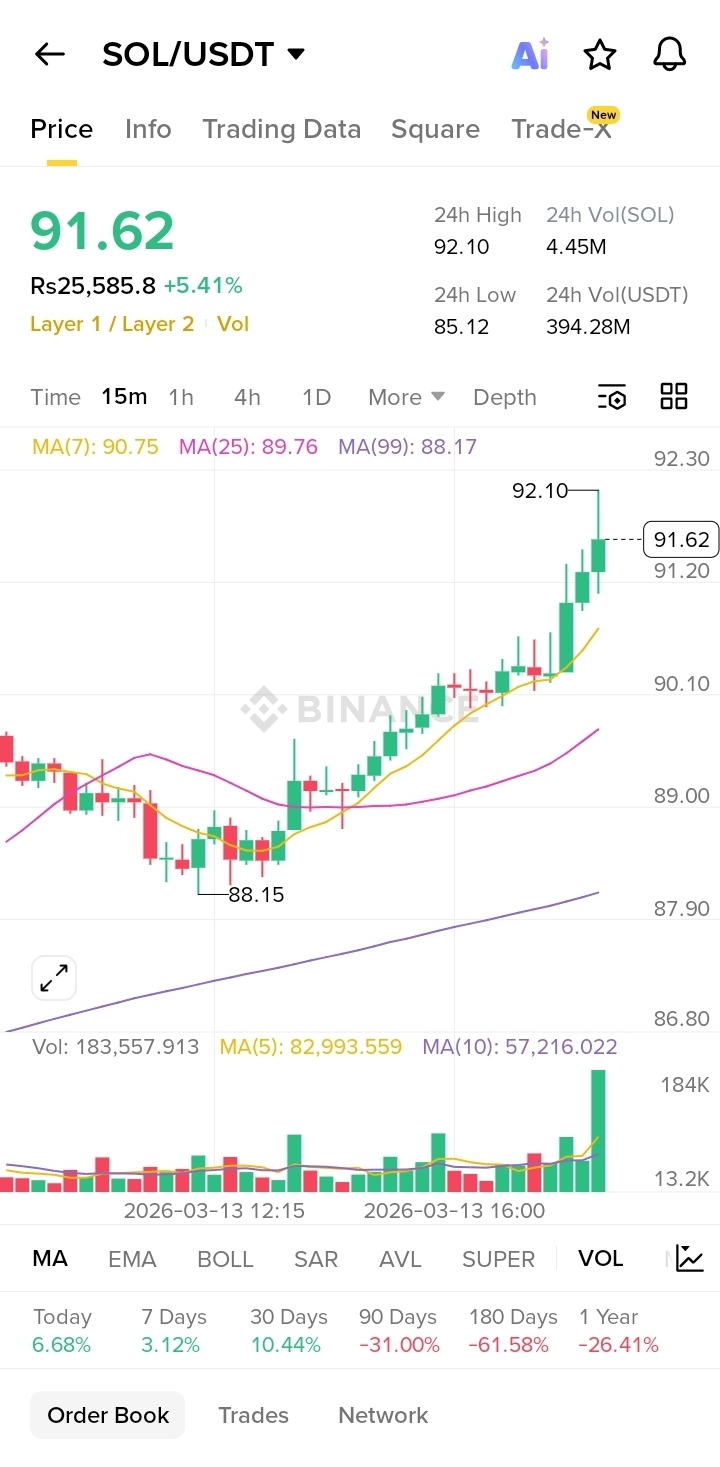
Solana (SOL) is showing a positive structure on the daily timeframe with consistent higher lows. Buyers are maintaining control as the price holds above key support zones. If bullish momentum continues, SOL may attempt to test the next resistance levels.
Key Support Levels:
145 USDT
135 USDT
Key Resistance Levels:
160 USDT
175 USDT
Technical Indicators:
Moving Averages: Price is trading near short-term moving averages, suggesting steady bullish momentum.
Volume: Healthy trading volume reflects continued trader interest in SOL.
Momentum: A breakout above 160 USDT could push the price toward 175 USDT.
Trading Setup (Educational):
Buy Zone: 145 – 150 USDT
Target 1: 160 USDT
Target 2: 175 USDT
Stop Loss: 135 USDT
⚠️ Disclaimer: This analysis is for educational purposes only. Always manage your risk and do your own research before trading.#sol