Market Watch – Analysis
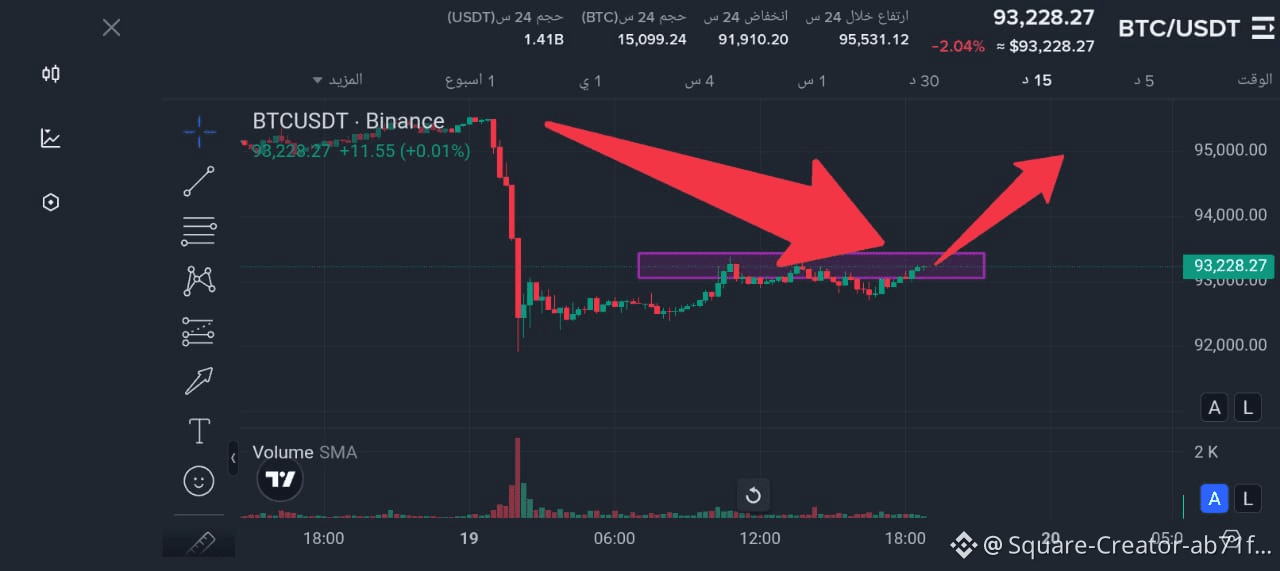
The crypto king is coiled like a spring! After a period of strategic consolidation, the BTC/USDT chart is flashing a major "Buy Signal" as it hovers around the critical $93,200 zone. Traders and whales are watching closely as Bitcoin prepares to exit its current range and target new local highs.
The Technical Setup: Why the Moon is Calling
The latest price action suggests that the recent dip was nothing more than a "bear trap." Here is why the bulls are taking control:
The "Purple Zone" Breakout: Bitcoin is currently testing a vital resistance belt (highlighted in the purple box). A clean break above $93,500 is expected to trigger a wave of FOMO (Fear Of Missing Out), sending the price surging toward the $95,000 and $98,000 milestones.
Strong Support Floor: Despite the market noise, BTC has maintained its ground above the $92,000 support level, showing incredible resilience and a lack of selling pressure at these prices.
Bullish Momentum: The arrows are pointing up! The current chart structure mimics a "bull flag" pattern, which historically precedes a vertical move.
Targeting the $100K Dream
The volume profile indicates that liquidity is being swept up by long-term holders. If Bitcoin closes a 4-hour candle above the current resistance, the path to $100,000 becomes clearer than ever. This isn't just a recovery; it’s a setup for the next leg of the 2026 bull run.
Bottom Line: The consolidation phase is nearing its end. As Bitcoin prepares to shatter the $94,000 ceiling, the question isn't if it will pump, but how fast it will hit the next target.
