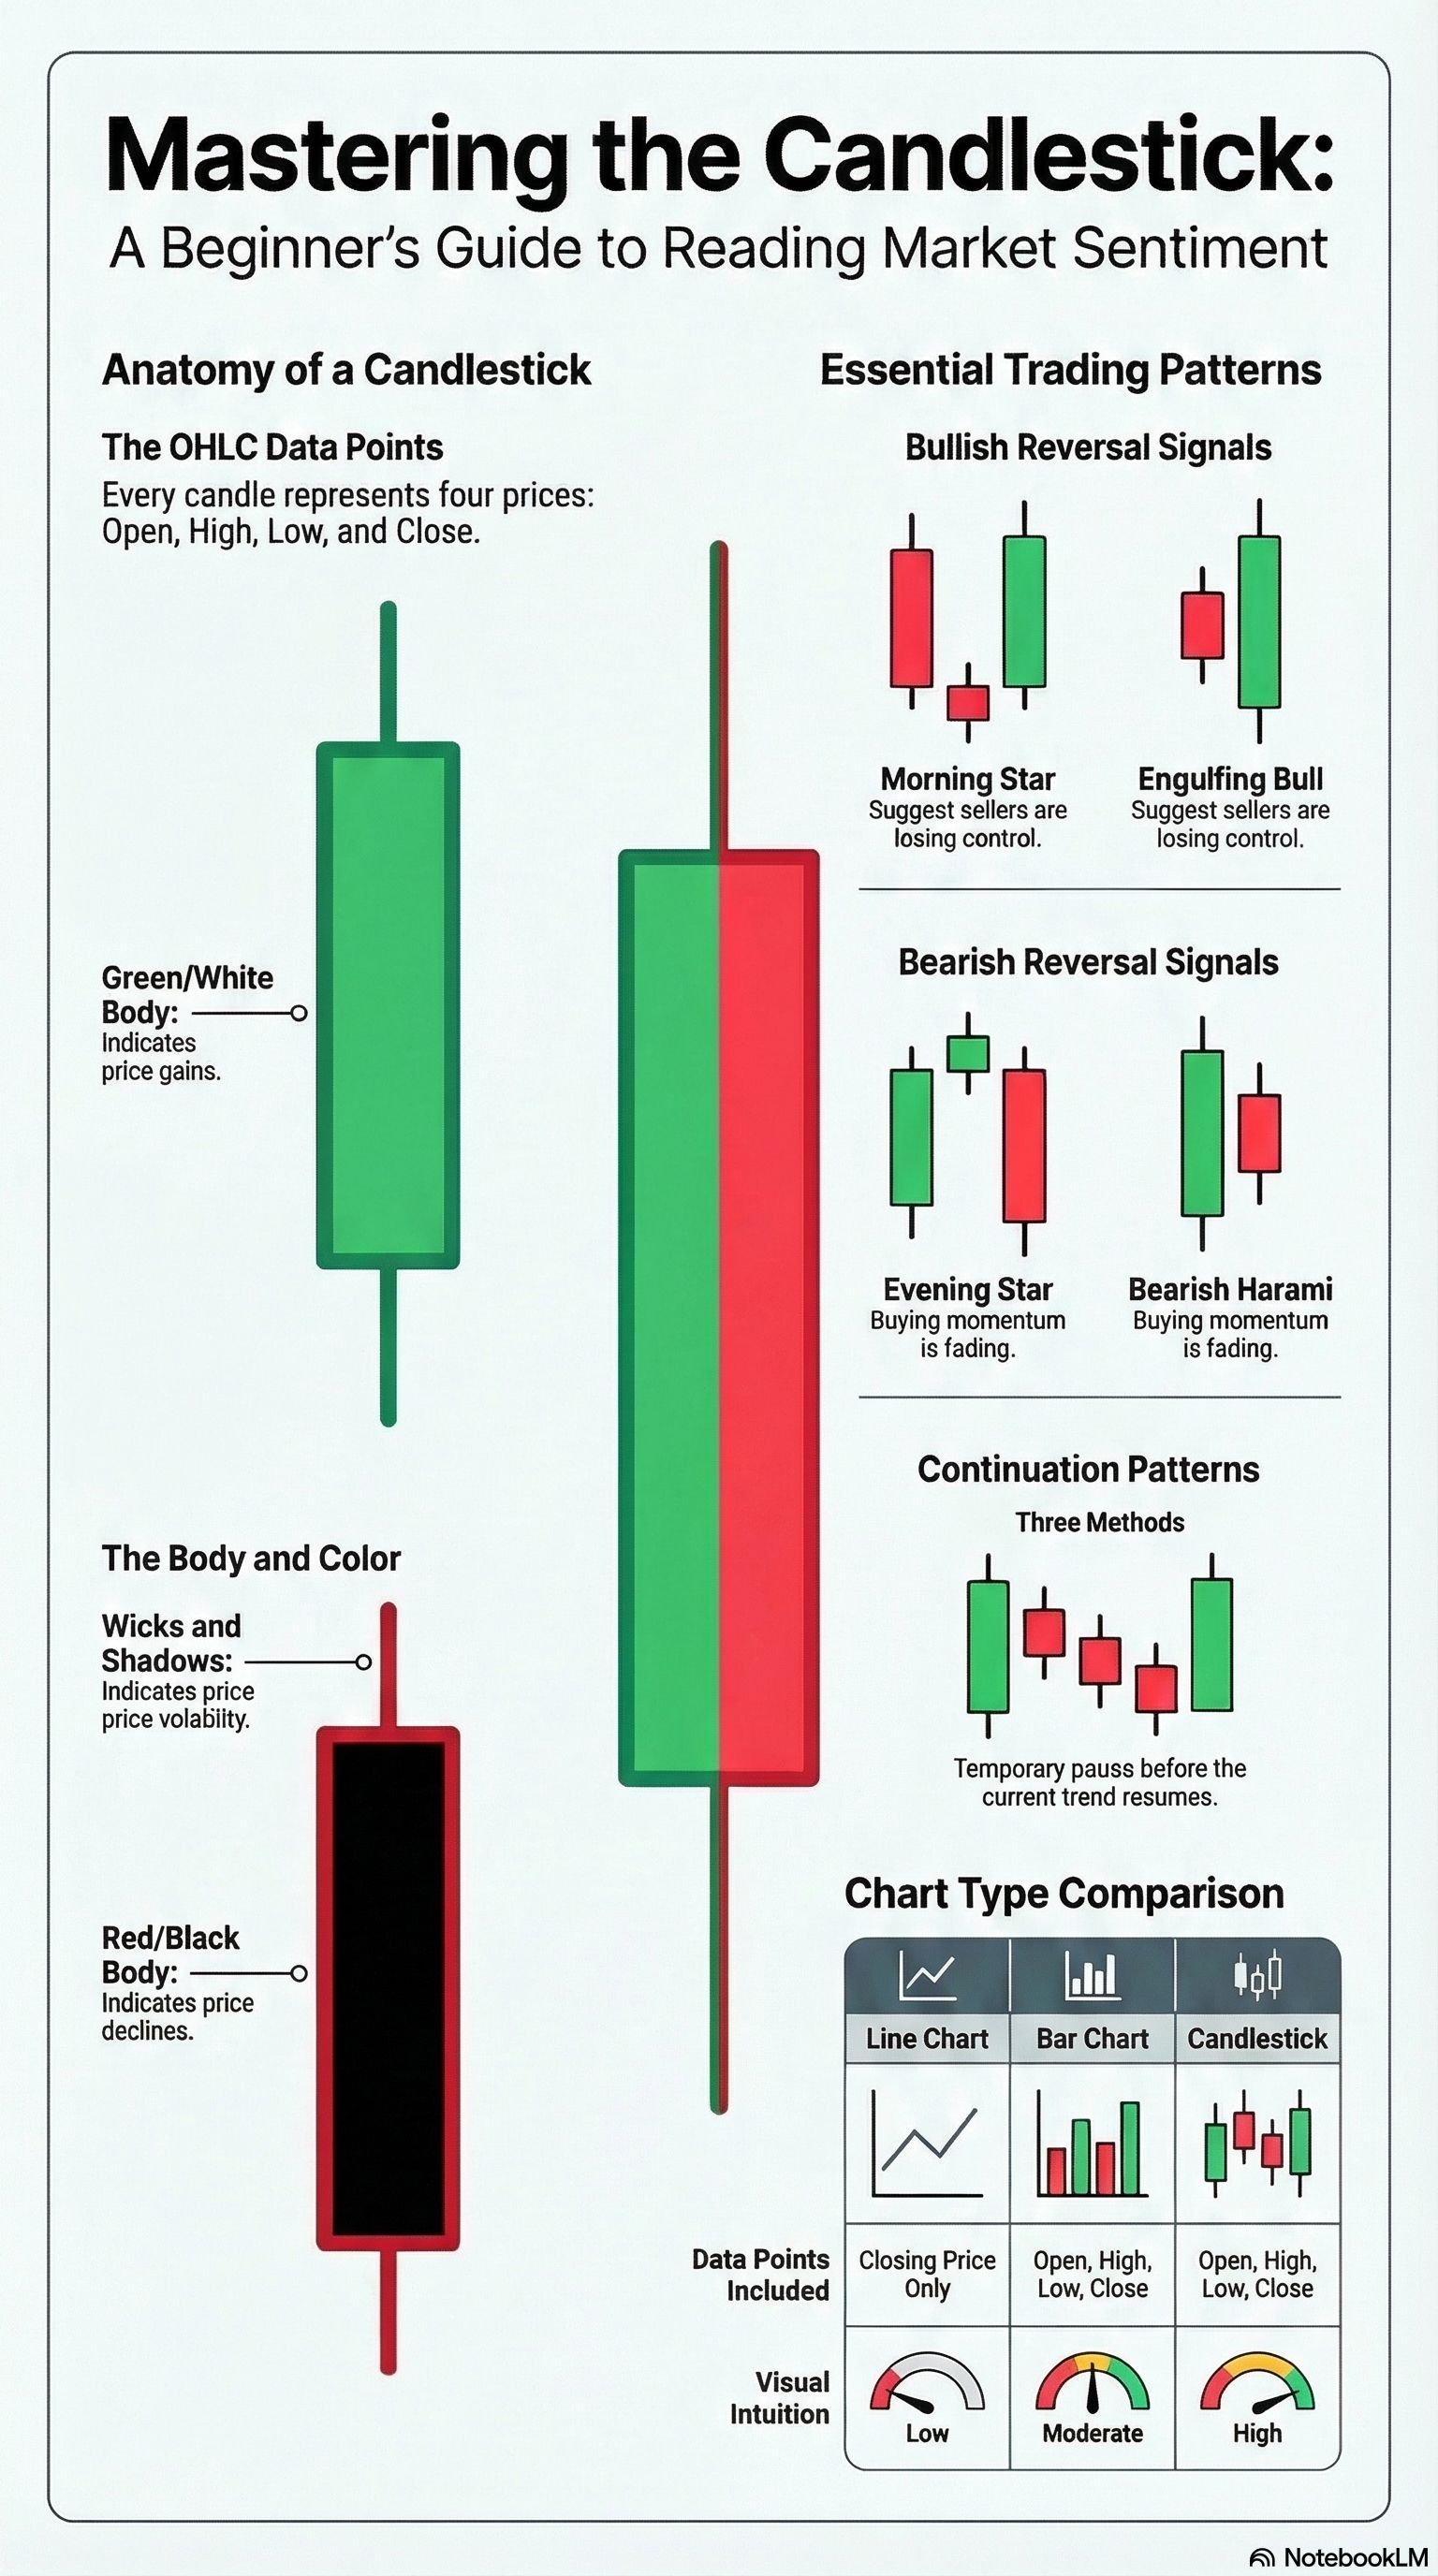
These patterns typically appear at the bottom of a downtrend and suggest that buying pressure is starting to outweigh selling pressure.
Bullish Engulfing: This is a two-candle pattern where a small bearish candle is followed by a much larger bullish candle that completely engulfs the body of the first. It indicates that bulls have taken control of the price action.
Bullish Harami: A two-candle pattern consisting of a large bearish candle followed by a smaller bullish candle that is contained within the body of the first. This suggests selling pressure is weakening and buyers are reasserting control.
Bullish Harami Cross: A variation of the Harami where the second candle is a doji (a candle with near-identical open and close prices), signaling a stalemate and the potential for bulls to take over.
Morning Star: A three-candle pattern that starts with a long bearish candle, followed by a small-bodied candle (representing indecision), and concludes with a strong bullish candle that confirms the reversal.
Common Bearish Reversal Patterns
These patterns generally occur at the top of an uptrend and signal that the upward momentum is fading as sellers take control.
Bearish Engulfing: A two-candle pattern at the top of an uptrend where a small bullish candle is followed by a larger bearish candle that engulfs its body, signaling an impending price decline.
Evening Star: The bearish counterpart to the Morning Star, this three-candle pattern features a long bullish candle, a small-bodied indecision candle, and a strong bearish candle that confirms the shift to a downtrend.
Bearish Harami: This consists of a large bullish candle followed by a smaller bearish candle contained within it, signaling that buying momentum is weakening.
Tweezer Top: A two-candle pattern where the highs of both candles are almost equal at the top of a trend, showing that bulls are unable to push the price higher
Keep in mind - traders should not rely on patterns alone. It is critical to wait for confirmation—such as a strong follow-through candle in the new direction—before considering a trend reversed. Additionally, using patterns in conjunction with other tools like support and resistance levels, volume analysis, and moving average crossovers can help reduce false signals.#Learn #study #PATTERN