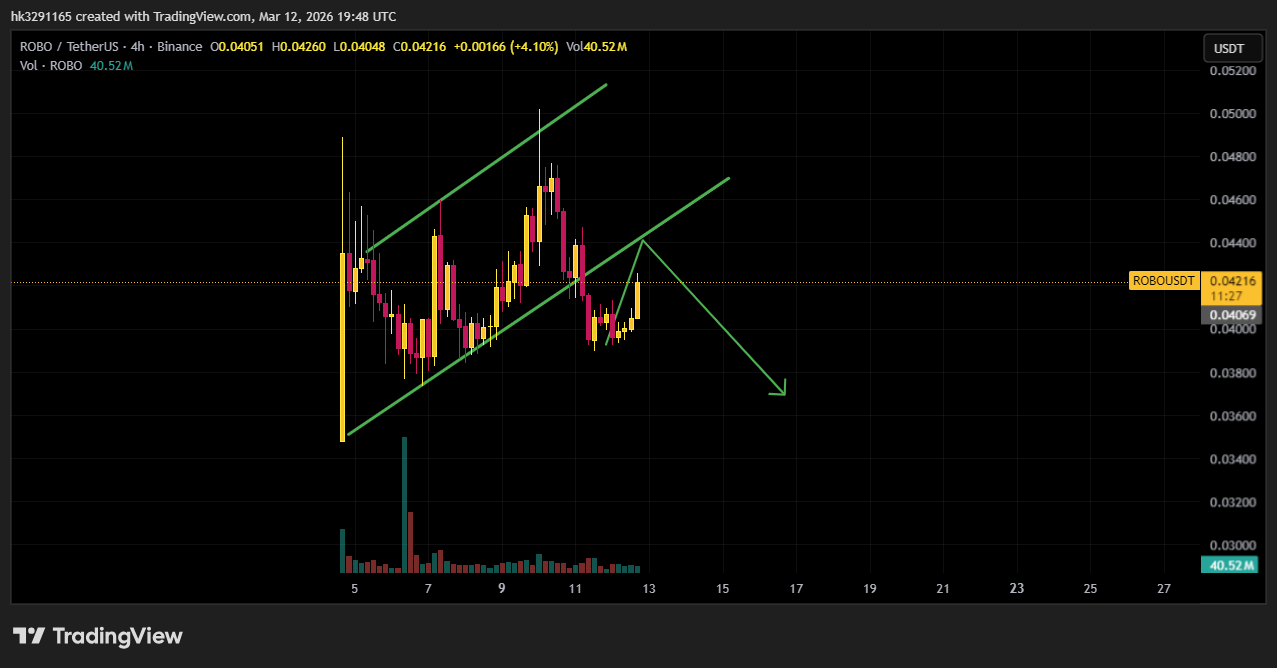
The ROBO/USDT chart on the 4-hour timeframe shows an ascending channel pattern, indicating that the market has been moving in a structured upward trend. In this pattern, price moves between two parallel trendlines: an upper resistance line and a lower support line. These lines represent areas where selling pressure and buying pressure repeatedly occur.
Market Structure
At the beginning of the chart, ROBO experienced a strong upward impulse with high volatility and volume. After that initial movement, the market began forming higher highs and higher lows, which is a key characteristic of an uptrend. The lower trendline acts as dynamic support, while the upper trendline functions as resistance.
The price recently moved near the middle of the channel around 0.042 USDT, showing a temporary bounce from the lower region of the structure. However, the chart also suggests that the price may test the upper boundary of the channel before determining the next major direction.
Resistance and Support Levels
The most important resistance zone lies between 0.044 and 0.046 USDT, which aligns with the upper channel trendline. If the price approaches this area again, sellers may attempt to push the market downward.
Key support levels are located around 0.040 USDT, followed by 0.038 USDT. These levels previously acted as strong buying zones and could again attract buyers if the price declines.
Possible Market Scenario
The drawn projection on the chart suggests that the price might first move upward toward the channel resistance and then face rejection. If that rejection occurs, the market could start a short-term correction, potentially moving down toward 0.038–0.036 USDT.
@Fabric Foundation #ROBO $ROBO