SOL/USDT Monthly Analysis – Major Support Zone in Play
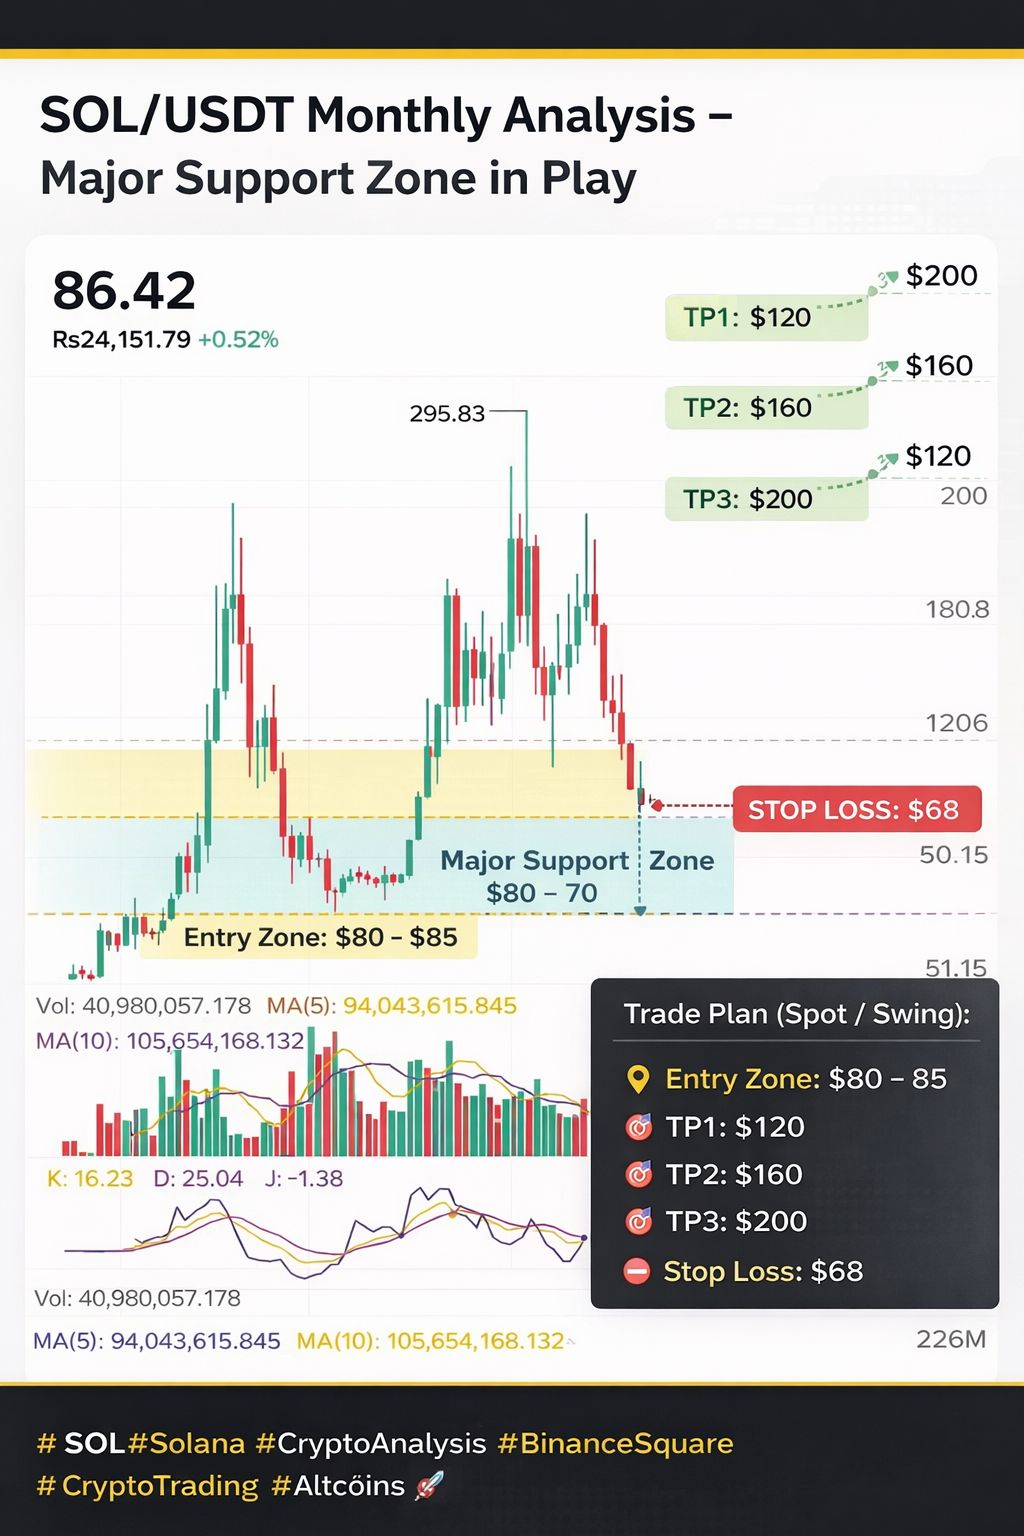
The monthly chart of Solana (SOL) shows that the price is currently trading around $86, after facing strong rejection from the previous high near $295. This long-term structure indicates a significant correction phase following the massive bullish rally.
Technically, $SOL is approaching an important support zone between $80 and $70. If this level holds, it could trigger a potential rebound toward $120, followed by $160 and possibly $200 in the mid-term. However, if the price breaks below $70, the market may revisit deeper liquidity around $50.
Volume on the monthly timeframe is gradually decreasing, suggesting the market is entering an accumulation phase where smart money could be positioning for the next cycle.
Trade Plan (Spot / Swing):
📍 Entry Zone: $80 – $85
🎯 TP1: $120
🎯 TP2: $160
🎯 TP3: $200
⛔ Stop Loss: $68
Overall, the long-term outlook for $SOL remains constructive as long as the key support zone holds. Traders should watch for confirmation before expecting the next bullish wave.
#SOL #Solana #CryptoAnalysis #BinanceSquare #CryptoTrading #Altcoins 🚀